‘Ten Years’ Apple Infographic: Moore’s Law At Its Best

Share
What's the difference between the high-end iMac desktop computer of 2000 and the iPhone 4G of 2010? A few pixels, £1000, and a lot of weight. Photographer Brett Jordan's "10 Years" infographic masterfully illustrates the power of Moore's Law and exponential growth by comparing these popular Apple products (see full scale photo below). While the prices have to be adjusted a little depending on where you live (in the US it's about $1200 for the iMac G3, and $599 for the iPhone 4) the overall truth is universal. The computing power in our hands is growing at an astounding rate that we may not realize on a day to day basis. This same growth, albeit in an earlier stage, is occurring in solar power, DNA sequencing, and other technologies. Trends like these are what make many of us believe that humanity is moving towards a developmental Singularity in the years ahead. No matter what your vision of the future, however, you can't deny the past ten years of astounding growth in computing. Jordan's work gives us a view of a decade of change shown side by side. It's more than a little awe-inspiring.
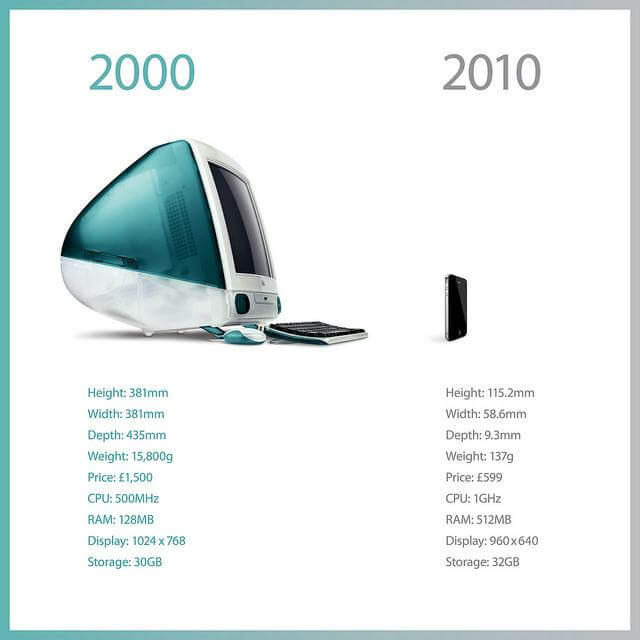
10 years has put the power of a desktop into your hand. What will the next decade bring?
Be Part of the Future
Sign up to receive top stories about groundbreaking technologies and visionary thinkers from SingularityHub.

[image credit: Brett Jordan via Flickr]
Related Articles

Weak AI Regulation Could Be Worse Than None at All
")
This Week’s Awesome Tech Stories From Around the Web (Through July 25)

Scientists Are Designing CRISPR Gene Editors With AI
Weak AI Regulation Could Be Worse Than None at All
This Week’s Awesome Tech Stories From Around the Web (Through July 25)
Scientists Are Designing CRISPR Gene Editors With AI
What we’re reading