Distributed Weather Network On Smartphones Crowdsources Data Meteorologists
A startup called Cumulonimbus Inc launched an Android app called PressureNET that displays barometric pressure and allowed users to submit their data. The latest version of the app goes a step further with a way for the 18,000+ users to not only visually display data but also opt-in on data sharing features. The startup wants to transform their app into a distributed, crowdsourced scientific platform that's open source using devices that people already carry around with them.

Share
Smartphone makers continue to pack more chips and sensors into mobile devices, but at some point one must ask: do we really need all of them in a phone?
Take the recent batch of Android-based devices from Samsung, like the Galaxy S3, and Motorola that have a tiny barometer embedded to measure atmospheric pressure. It's nothing too novel as modern watches have barometers in them. Unlike temperature and humidity which can vary considerably within a short distance, barometric pressure is relatively stable over larger distances (it's one of the more reliable components of a weather report). So, why pack smartphones with another sensor?
It turns out that atmospheric pressure is useful for other common smartphone features: the determination of elevation. Air pressure changes with altitude, so a phone could compare a pressure measurement on the phone to nearby weather stations at fixed heights to determine altitude and improve the accuracy of GPS location. Combined with other chips that are utilizing wireless and other techniques, barometric pressure could also prove useful in making incredibly precise location-tracking possible, even inside buildings.
Putting more sensors in smartphones also provides Android app developers with more hardware to work with, and hence, they come up with clever software to use these data in interesting ways. Case in point, in 2011 a startup called Cumulonimbus Inc launched an Android app called PressureNET that displays barometric pressure and allowed users to submit their data. Nothing spectacular but it allowed people who were interested in this kind of information to check their phones.
But in January, version 3.0 of the app was released with a way for the 18,000+ users to not only visually display data but also opt-in on data sharing features. Beyond creating a better altimeter app, what Cumulonimbus really wants to do is share this data with scientists to help them prepare better weather and climate models.
In other words, the startup wants to transform their app into a distributed, crowdsourced scientific platform that's open source using devices that people already carry around with them.
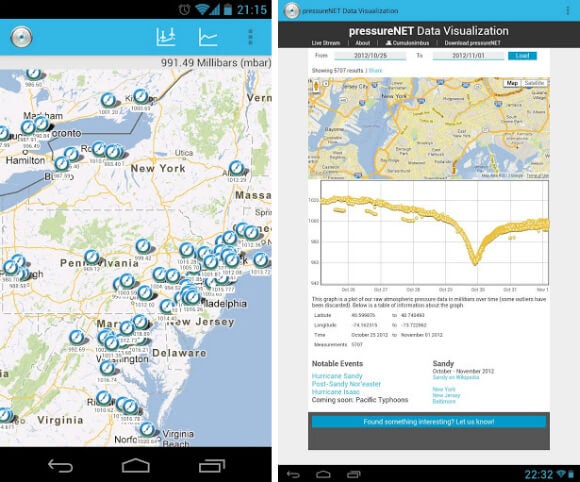
PressureNET app (left) and the accompanying website (right) allow users to see their barometric measurements and the crowdsourced data.
Currently, scientists use data from the network of barometers that are maintained through NOAA weather stations, but because of the sheer number of smartphones around, much higher resolution could be achieved through PressureNET. Yet, in order for the app to achieve this level of regional sensitivity, the startup estimates that they'll need a million smartphones collecting and sharing data.
Be Part of the Future
Sign up to receive top stories about groundbreaking technologies and visionary thinkers from SingularityHub.

Therein lies the challenge. Atmospheric pressure might be highly valuable to meteorologists and pilots, but to the general public, it is only a general measure of weather patterns or as monitors of tornado and hurricane strength. Even if people in Tornado Alley and along the hurricane zones of the Gulf Coast and Eastern seaboard got the app, the most utility will likely come out of having a geographically dispersed set of data. Still, the app is currently pulling in about 4,000 data points per hour.
The potential for using the data in 'nowcasting' of weather, including early warning systems, is promising. Barometric pressure measurements are much less sensitive to the surrounding environment, so a smartphone should produce the same measurement whether in a hand, a purse, or a pocket. That means greater accuracy and precision, and thus, more reliable data.
It isn't just weather prediction that could benefit from PressureNET data; once the datasets are widely available, medical researchers studying seasonal-related conditions could find a slew of correlations. Psychologists and sociologists might find that much more of our behavior is influenced by atmospheric pressure than we realize. It might even have impact on stock market traders. There may be an entire fields of analysis and prediction deriving from the data gathered.
In light of this, increasing the number of sensors and improving the sophistication of apps can turn each smartphone-toting person into a data collection machine, especially with increasing proliferation of smartphones.
If you are interested in looking at the change in barometric pressure over time in your own region, you can go to the website to see the first of the data visualizations the team has put out. Looking at charts may not be the greatest thrill now, but it will be interesting to see the kinds of dynamic maps that can be developed, especially ones that show the fine detail of pressure changes during severe weather.
[images: Cumulonimbus, NOAA]
Related Articles

This Portable Wind Turbine Is the Size of a Water Bottle and Charges Devices in Under an Hour

Mojo Vision’s New Contact Lens Brings Seamless Augmented Reality a Step Closer
The Weird, the Wacky, the Just Plain Cool: Best of CES 2020
This Portable Wind Turbine Is the Size of a Water Bottle and Charges Devices in Under an Hour
Mojo Vision’s New Contact Lens Brings Seamless Augmented Reality a Step Closer
The Weird, the Wacky, the Just Plain Cool: Best of CES 2020
What we’re reading