

“Data analysis.” Sounds exciting, right? Most of us would sooner put out an eye than crunch some numbers. But what if you could trade in that Excel spreadsheet for a giant, 360 degree visual sphere with a kickin’ sound system? Science just got a whole lot trippier.


In the early days of science, checking out your data was easy: there wasn’t very much of it. Collecting data was the hard part; analyzing and cataloging it was a relatively straightforward affair. But the times, they are a-changin’. Nowadays, complex research can spit out mountains of data, making analysis a confounding and time-consuming process. Plus, it can be pretty boring. That is, unless you have an AlloSphere handy.
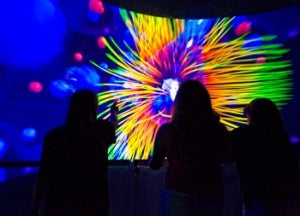
The AlloSphere is a data presentation instrument – environment, really – that allows researchers to explore complex datasets in a fully immersive audiovisual environment. It is composed of two 5-meter radius hemispheres with a catwalk along the middle for researchers to stand on. From this perspective, they can watch visual representations of their data surround them, whether they are interested in neural activity or quantum fields. At the same time, other data can be represented in audio form, making the data exploration a multimedia affair. And to top it off, it’s real-time responsive, letting users manipulate the data they look at.
To get an idea for its broad applications (and to see it in action) check out this amazing video from this year’s TED conference:
Developed over the process of twenty four years, the AlloSphere is housed at UC Santa Barbara’s California NanoSystems Institute building. Its unique construction provides a 360 degree visual field for data to be presented, projected onto the hemispheres by video projectors. About 500 speakers are placed around the sphere, providing 3D sound to accompany the visual display. It takes up a 3-story cube, surrounded with sound absorption material so that audio doesn’t echo. The catwalk can fit from 20-30 people inside at a time, so your whole chemistry class can take a field trip.
So what kinds of data does the AlloSphere accommodate? Physicists seemed to have jumped right on board, using the system to visualize hydrogen bonding and quantum mechanical wavefunctions. Another project is working to provide a 3D visualization of nanoscale structures (yes, with the silly glasses) that a user can interact with and manipulate. My favorite is the AlloBrain, which lets the user navigate macroscopic fMRI datasets and hear blood flow in the brain as audio. Heck, they’re even trying to get Google Earth running on this thing.

Got some ideas for the AlloSphere? They’re open to suggestions. The hardware is all up and running, and they’re looking for new software ideas to explore the possibilities of how their new toy can be applied. Their doors are open to art projects, green technology, nanotech, national defense applications, medical breakthroughs, psychologists, physicists, educators, you name it. If you’ve got a cool idea that could use a little audiovisual immersion, the Allosphere is listening. I personally promote a Pink Floyd laser light show, but that’s just me.
The AlloSphere gives scientists an innovative way to look at their data, hopefully inspiring a few “eureka” moments along the way. It also makes science really cool, engaging young students by bringing lofty concepts back down to earth and into an IMAX style presentation. We’re getting a glimpse into the future of how technology can help us to experience and explore scientific data, making it beautiful and engaging (not to mention educational).
And now, back to writing my own proposal. Prepping next year’s tax return is gonna be a blast. Hopefully.