Japan’s Nuclear Woes Give Rise to Crowd-Sourced Radiation Maps In Asia and US
Share

Crowd-sourced maps like this one allow the public to view radiation levels as monitored by users.
The world's eyes have been on Japan, watching the nation cope with earthquakes, tsunamis, and now the threat of poisoning from nuclear radiation. While the nation's emergency workers are making valiant efforts to combat dangers from the Fukushima I Nuclear Power Plant, concerned citizens around the globe are searching for ways to keep themselves informed and aware in case of a pending crisis. Luckily they live in an age when sharing information is as easy as logging on to the internet. In the past few weeks, several crowd-sourced radiation maps have arisen that attempt to give up to the minute looks at the threat level in the areas most likely to be affected by a catastrophe: Japan, Asia, and the US. These maps, available to the public for free online, are a timely example of how user-enabled systems are revolutionizing the way we solve problems. Tracking radiation levels is just the beginning. This is a preview of how accelerating technologies will allow us to monitor anything, anywhere, in realtime.
One of the best of the new radiation maps was developed by Portland's Uncorked Studios. In only 72 hours they created RDTN.org, an online display of up to date radiation levels across Japan and neighboring regions. Their information is gathered from volunteer and official sources and embedded onto an adapted Google Map. Three days from concept to a working map that gives valuable and reliable data to anyone who wants it for free, and not a dollar was spent in its production. Amazing.
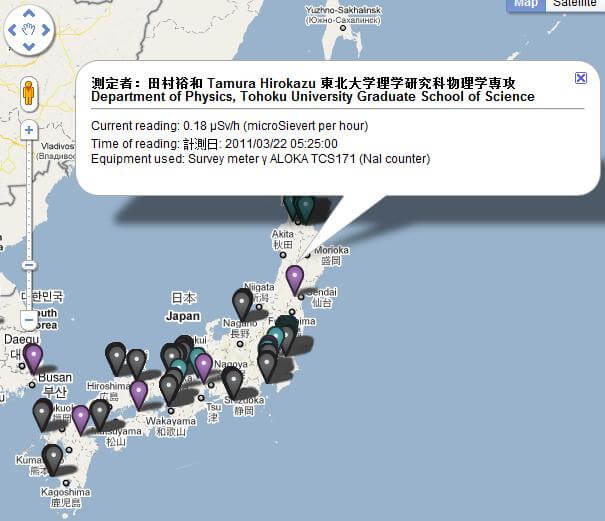
RDTN.org provides regularly updated radiation levels on a Google map. Click to go to live site.
Another great map of radiation levels was created by South Korean firm ISELSoft using their STUBBY web bots. The Stubby map compiles data from the web, gathering readings from various monitors across Japan, Korea, and Central Asia. It also color codes the data to reflect hazard levels. While it doesn't have as many data points as RDTN, it is clear, easy to read, and regularly updated. Another winner.
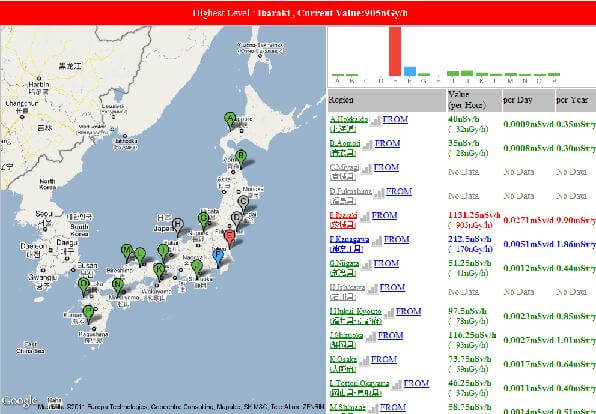
Web bots gather data to form this STUBBY map. Click to go to live site.
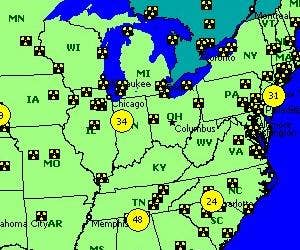
While many of those wanting to track radiation levels after the Fukushima accident do so out of sympathy for Japanese citizens, let's not ignore the fact that many others are simply worried about when dangerous radiation levels could show up in their own backyard. Along with maps detailing Japan, there are also a few looking elsewhere on the globe. The best example was created by Mineralab, producers of Geiger counters and related supplies. Their Radiation Network map shows radiation levels reported from individual monitors across the US. It also marks the location of nuclear facilities. The map is updated every minute, giving you radiation readings almost in realtime.
There are several reasons why RDTN and the Stubby map are superior in my mind to the Radiation Network: They include a large amount of data from a number of reputable sources, they focus on the area most concerned with the accident, and the quality of their images seems better. Radiation Network, however, may give us a better idea of what we can expect in the future. While the first two maps are specifically geared towards the Fukushima Nuclear Power Plant crisis, the latter is taking a much broader scope.
Be Part of the Future
Sign up to receive top stories about groundbreaking technologies and visionary thinkers from SingularityHub.

Mineralabs sells Geiger counters. They also sell software (GeigerGraph Network) that allows you to easily share your data with others via the Radiation Network. When you become a monitor on that network, you also get better features (zoom on the map, descriptions of nuclear facilities, chat rooms, etc). Ostensibly, the Radiation Network could expand and become more informative as more users join the network. Because Mineralabs is making money from the venture (~$80 for the GeigerGraph Network software and data cable to transmit from your Geiger counter, which probably costs several hundred dollars on its own) they have a vested interest in keeping that network up and running well after this latest nuclear incident passes. That being said, while Mineralab actually sold out of Geiger counters after the recent incident in Japan, the Radiation Network itself is rather pitiful at the moment, just 15 or so active monitors. They also only measure Counts Per Minute, which is far from the most useful data when concerned with nuclear radiation. Radiation Network's message board describes how they are overcoming their limitations...but yeah, this is certainly a work in progress.
It's one of many such projects that are hoping to leverage crowd-sourcing, massive flows of data, and continuous monitoring in ways that are both profitable and a public service. RDTN, Stubby, and Radiation Network are sitting at the crux of several trends. We've got the next generation of digital maps which are incorporating all kinds of user-generated data - from photos to food reviews. We also have the emerging Internet of Things - the general term given to the expanding network that handles the flow of data from RFID tracking systems and smart devices. The IoT keeps us aware of the temperature on foods, the tamper seals on prescription drugs, and environmental information at monitoring stations. We're starting to track our own body functions in the same way. All this data, all this sharing, may seem overwhelming when you try to envision it in its entirety. Yet the radiation maps above demonstrate how powerful and democratizing this information can be when funneled through the right applications. We've started publicly monitoring radiation in response to a crisis. Next we could track weight and health in populations in realtime. Or record water purity levels in major rivers. Whatever problem you see, there could be a data-driven, crowd-enabled monitoring system we could create to help solve it. The technology is mostly here already. It's just waiting for us to apply.
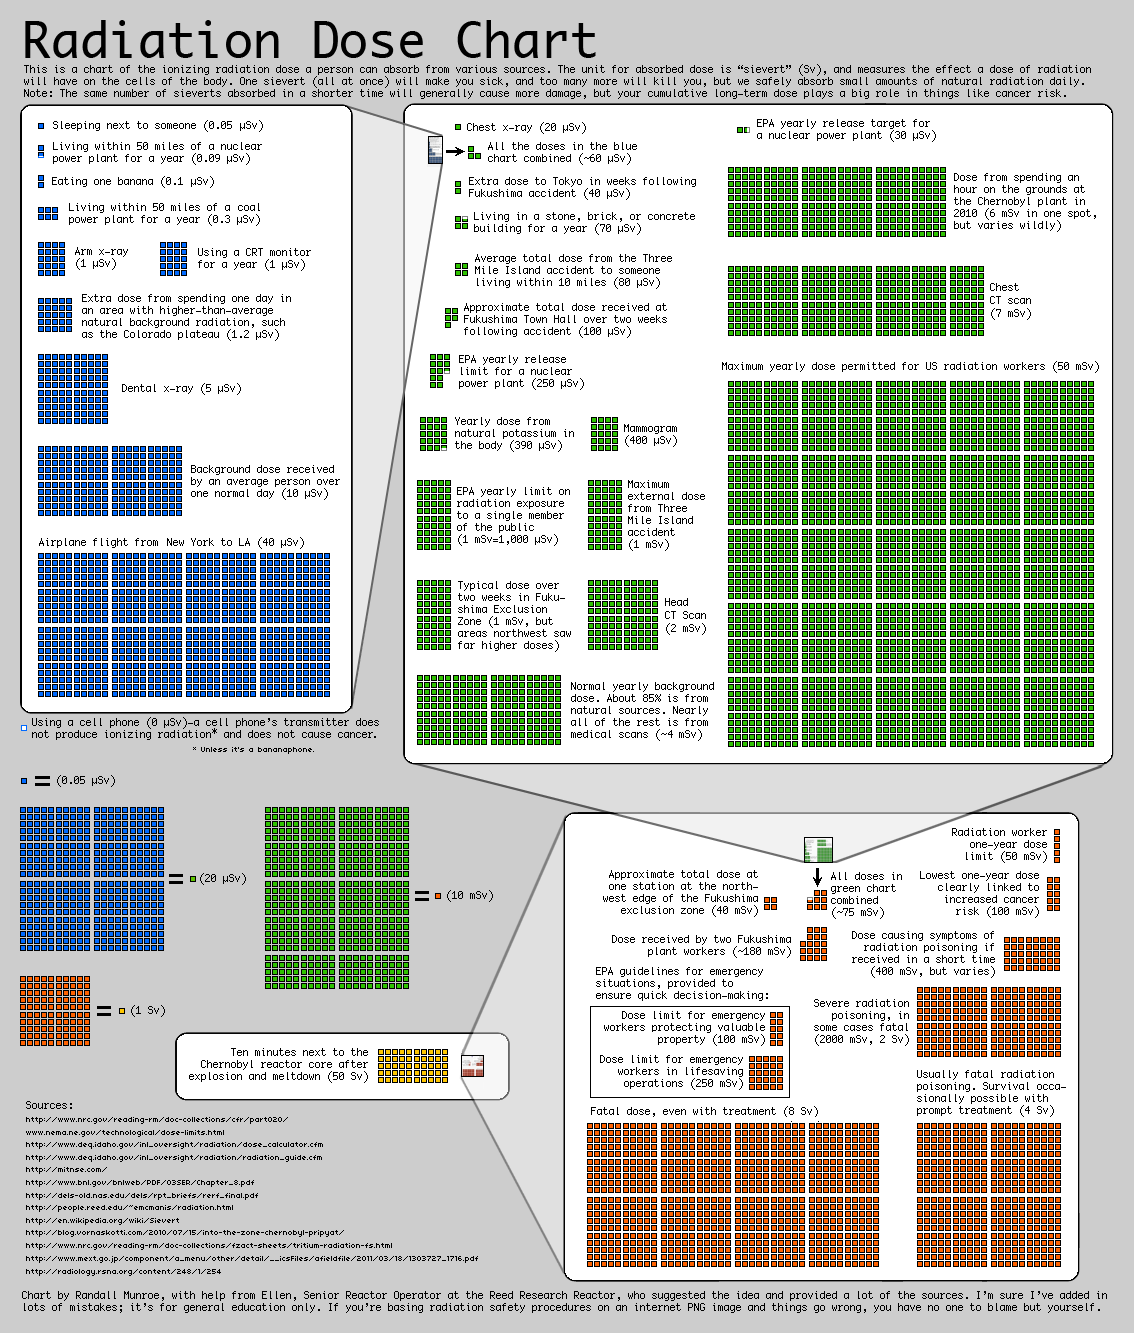
*Note. I know that many of my friends in the US have been confused about the immediate repercussions surrounding the nuclear incident at Fukushima. I hope the maps above will give you an easy way to stay informed. Understanding what the radiation levels listed on those maps actually mean, however, can be challenging. For that, I leave you with one of the clearest (though not most official) diagrams to understanding what radiation you can tolerate, when. Take a look at it below (click for better resolution). Thanks to XKCD's Randall Munroe for doing such a great service and putting this chart in the public domain.*
[image credits: Radiation Network (Mineralab LLC), RDTN (Uncorked Studios), ISELSoft, XKCD (orig. Randall Munroe, chart is now in public domain)]
[sources: Radiation Network, Uncorked Studios Blog, ISELSoft]
Related Articles

This DNA Switch Could Control Molecular Machines

These Seven AI Rings Translate Sign Language in Real Time

AI Companies Are Betting Billions on AI Scaling Laws. Will Their Wager Pay Off?
This DNA Switch Could Control Molecular Machines
These Seven AI Rings Translate Sign Language in Real Time
AI Companies Are Betting Billions on AI Scaling Laws. Will Their Wager Pay Off?
What we’re reading