


Your mindset matters — now more than ever.
We are in the midst of a drug epidemic.
The drug? Negative news. The drug pushers? The media.
As I wrote in Abundance: The Future Is Better Than You Think, we pay 10x more attention to negative news than positive news.
We are being barraged with negative news on every device. This constant onslaught distorts your perspective on the future and inhibits your ability to make a positive impact.
In this post, I’ll share new “evidence for abundance” — charts and data that show the world is getting better. I’ll also share positive news and technological breakthroughs, all of which occurred in 2017 so far.
Note: This isn’t about ignoring or minimizing the major issues we still face around the world. It’s about countering our romanticized views of the world in centuries past with data.
My hope is that you’re able to see the world as it is — a world that is still getting better. My goal here is to help you protect your abundance mindset despite this barrage of negative news.
If you have a negative-minded person in your life, forward this blog to them so they can look at the actual data.
Let’s dive in.
1. Global Economy
The first area to explore is our global economy. Over the last 200 years, the world’s GDP has skyrocketed 100-fold. Humankind has never been more prosperous and productive.

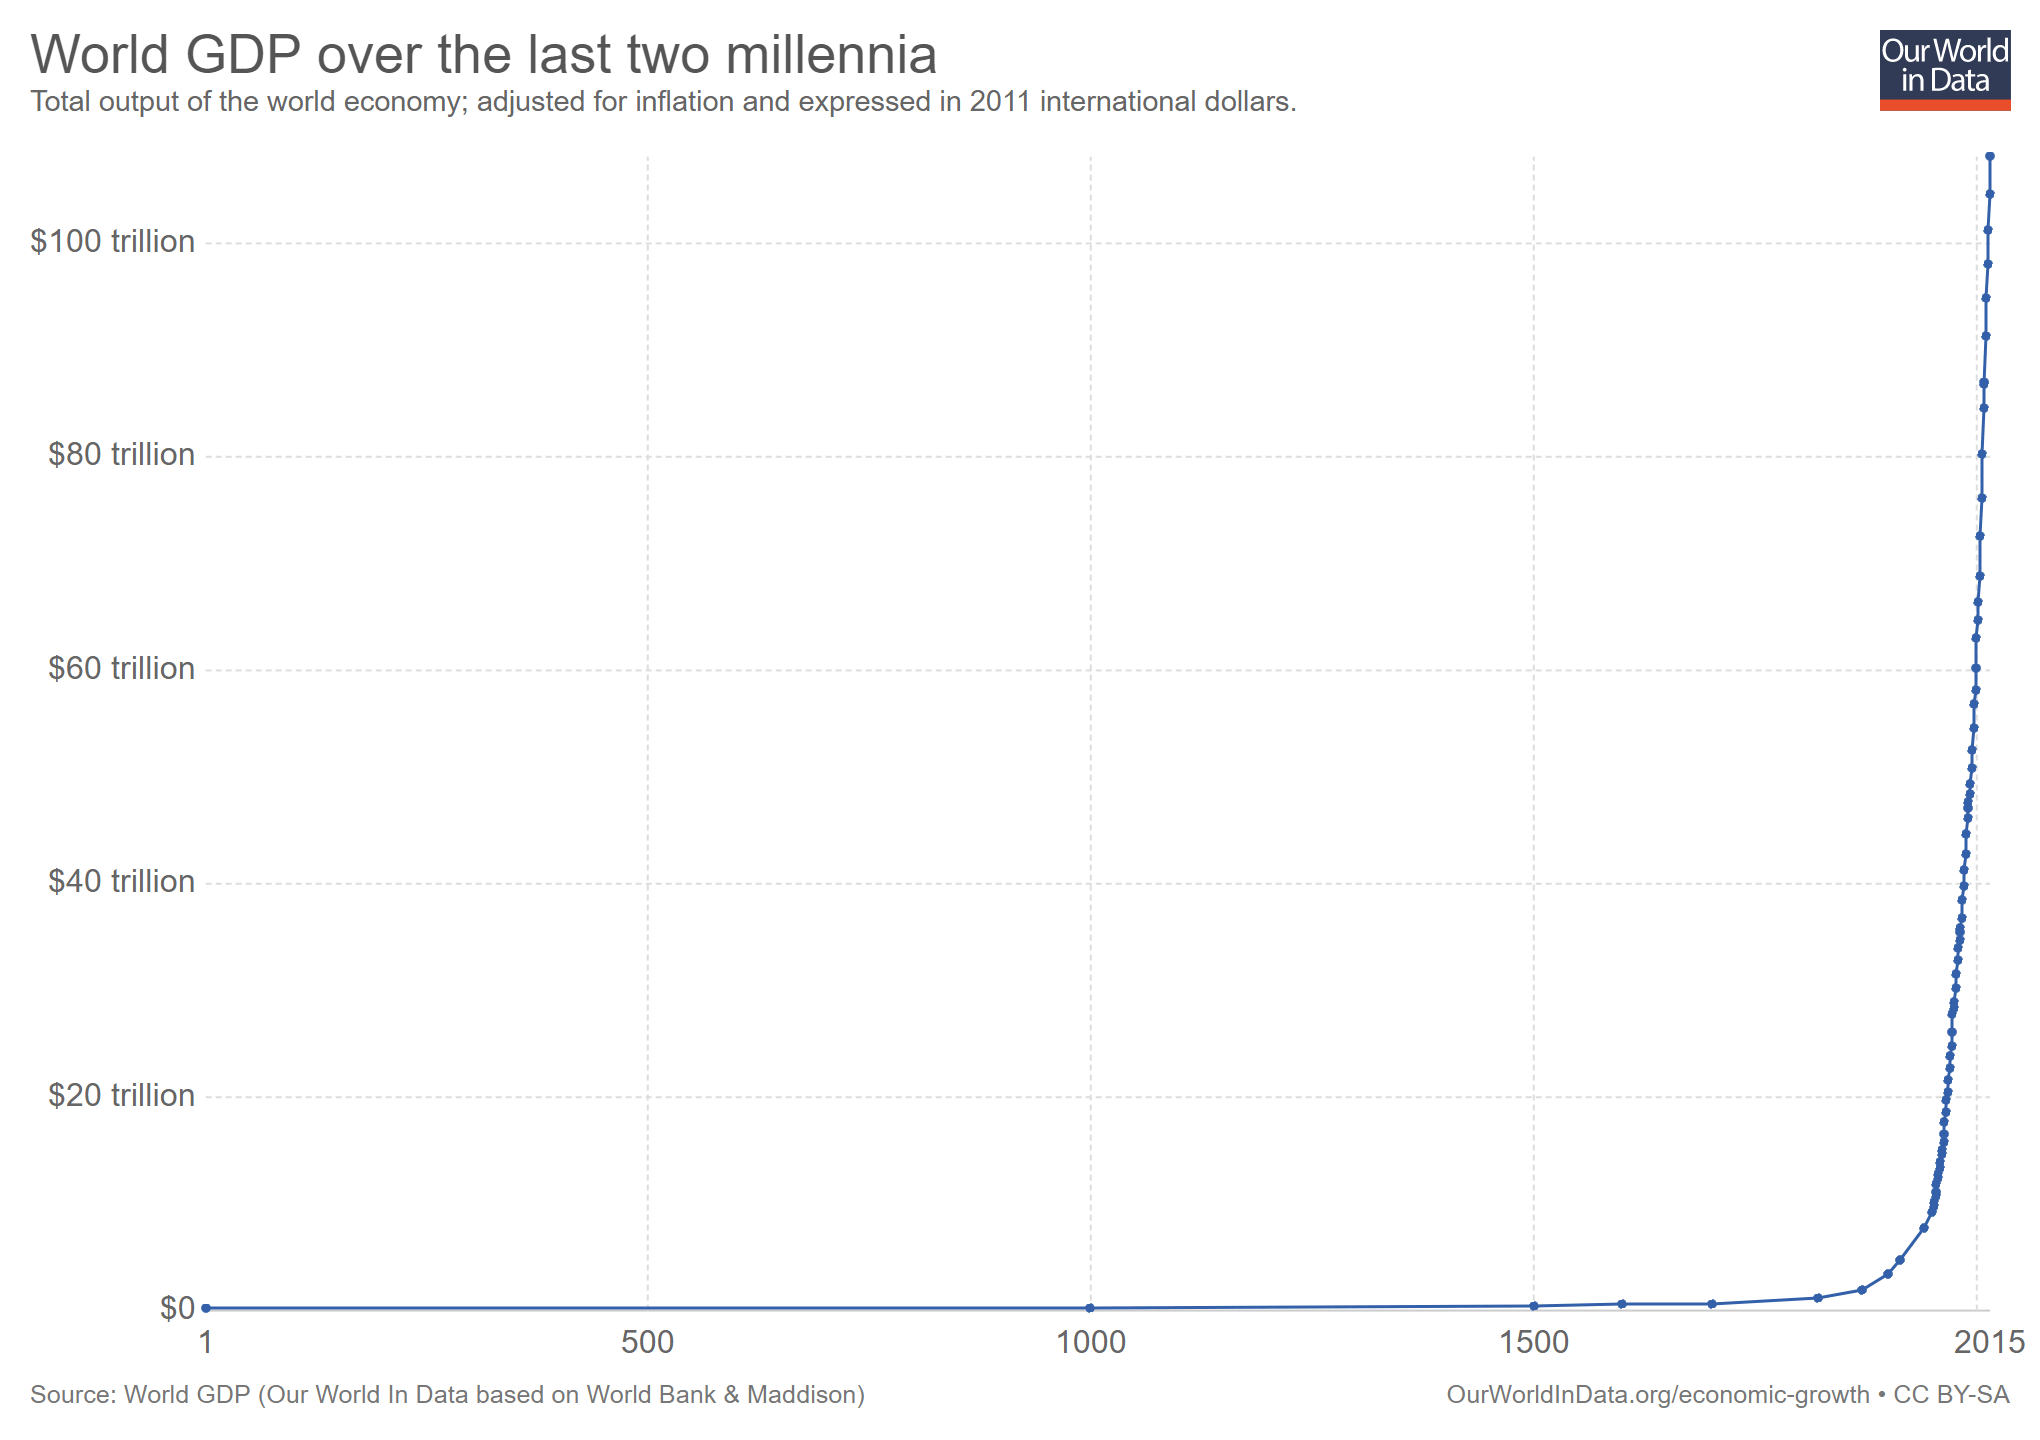
The graph above depicts the economic output per person around the world over the last 2,000 years. Here we see exponential growth independent of war, famine, or disease.
Technology drove much of this economic growth, and there are no signs of slowing.
Banking the Unbanked: One especially promising area of economic growth involves empowering the “unbanked” — the two billion people worldwide who lack access to a bank account or financial institution via a digital device. In September 2017, the government of Finland announced a partnership with MONI to create a digital money system for refugees.
The system effectively eliminates some of the logistical barriers to financial transactions, enabling displaced people to participate in the economy and rebuild their lives.
Refugees will be able to loan money to friends, receive paychecks, and access funds using prepaid debit cards linked to digital identities on the blockchain — without a bank.
Blockchain and Government: Governments are investing aggressively in digitization themselves. The small country of Estonia, for example, already has an e-Residency program. The digital citizenship lets residents get government services and even start companies in the EU without ever traveling or living there.
In late August 2017, Kaspar Korjus, who heads up the e-Residency program, revealed the Estonian government’s exploration of creating an initial coin offering (ICO) and issuing crypto-tokens to citizens to raise government funds.
That same month, the Chinese government announced its intent to use blockchain technology for collecting taxes and issuing invoices. This builds on previous experiments China’s central bank is conducting with its own cryptocurrency.
2. Health
No matter where in the world you are, mortality rates have dropped precipitously over the last 300 years.
The following chart shows life expectancy at birth in various countries. Just 100 years ago, a child born in India or South Korea was only expected to live to 23. Fast forward to today, and India’s life expectancy has tripled. South Korea’s life expectancy has quadrupled and is now higher than in the UK.

Plummeting Teen Births: Another measure of a nation’s health is how it responds to preventable public health issues. Here in the US, teen births are down an impressive 51 percent over the last decade, going from from 41.5 births per 1,000 teenage girls in 2007 to 20.3 births per 1,000 teenage girls in 2016.
I share the following graph because, by the numbers, teen girls who have babies will have a harder life than their peers who delay motherhood.
As the US Department of Health and Human Services notes, they’re more likely to drop out of high school, rely on public assistance, and have children with “poorer educational, behavioral, and health outcomes over the course of their life than kids born to older parents.”
Since these statistics were first compiled in 1991, teen births have dropped 67 percent.


As exponential technologies continue to advance, we’ll see even more healthcare breakthroughs. Here’s a sampling from this year:
Exponential Tech Impact on Health: Most exciting these days is the tremendous impact that exponential technologies are having on health.
- Robotics: Last month, a robot dentist in China successfully implanted 3D-printed teeth into a female patient’s mouth with “high precision.” The only human medical staff involvement was to conduct light setup and a pre-test. Imagine when such robots are in every healthcare facility on the planet, delivering service for the cost of electricity.
- Virtual Reality: VR is also entering the operating room. In July 2017, University of Minnesota doctors used VR to prepare for a challenging non-routine surgery — separating a pair of twins conjoined at the heart. Not only was the life-saving surgery a success, the VR prep gave doctors unforeseen insights that prompted them to accelerate the surgery by several months. It won’t be long until we refuse to have surgery completed by any human who hasn’t prepared in virtual reality using a personalized 3D model.
- CRISPR/Gene Editing: Finally, in August 2017, the Food and Drug Administration (FDA) approved the first-ever treatment that uses gene editing to transform a patient’s own cells into a “living drug.” Kymriah, a one-time treatment made by Novartis, was approved to treat B-cell acute lymphoblastic leukemia — an aggressive form of leukemia that the FDA calls “devastating and deadly.” The FDA is currently considering over 550 additional experimental gene therapies. What happens to our healthy human lifespan as these life-saving treatments demonetize and become universally accessible?
3. Environment
Thirty years ago, the world signed the Montreal Protocol to prevent the depletion of the ozone layer. Today, the US Environmental Protection Agency (EPA) credits that agreement with preventing an estimated 280 million additional cases of skin cancer, 45 million cataracts, and 1.5 million skin cancer deaths between its signing in 1987 and the year 2050. Without the Montreal Protocol, the planet would have been about 4 degrees warmer by 2050 (resulting in more extreme weather events like droughts, floods, and hurricanes).
As the graph below clearly depicts, the global annual death rate from natural disasters has plummeted over the past century.


Why has this happened? It’s the impact of exponential technologies (satellites, sensors, networks, machine learning), which enable humans to better image, predict and model disasters. These models provide early warning systems, enabling citizens to flee to safety and for first responders to send supplies and food to remote areas in time.
Drones and the Environment: Previously, animals were counted manually by researchers who had to spot them from helicopter or prepositioned camera footage. Now, a drone captures footage, the machine learning system counts different types of animals, and human volunteers help train the algorithm by verifying detections.
Faster, cheaper, easier, and more accurate.
And in Bengaluru, researchers at the Indian Institute of Science are fighting deforestation with camera-equipped drones that drop seeds in areas they otherwise wouldn’t be able to explore. Their goal is to seed 10,000 acres in the region.
What becomes possible when thousands of teams — not simply individuals and a handful of research teams — leverage these tools to protect the environment?
4. Energy
A key measure of economic growth, living standards, and poverty alleviation is access to electricity.
This graph uses data from the World Bank and the International Energy Agency’s definition of electricity access, which is delivery and use of at least 250 kilowatt-hours per year in rural households and 500 kilowatt-hours per year in rural households.
Simply put, more people around the world have access to electricity than ever, and the absolute number of those without access to electricity is dropping (despite population growth).
Take a look at the chart below to see how various regions of the world are meeting their energy needs.
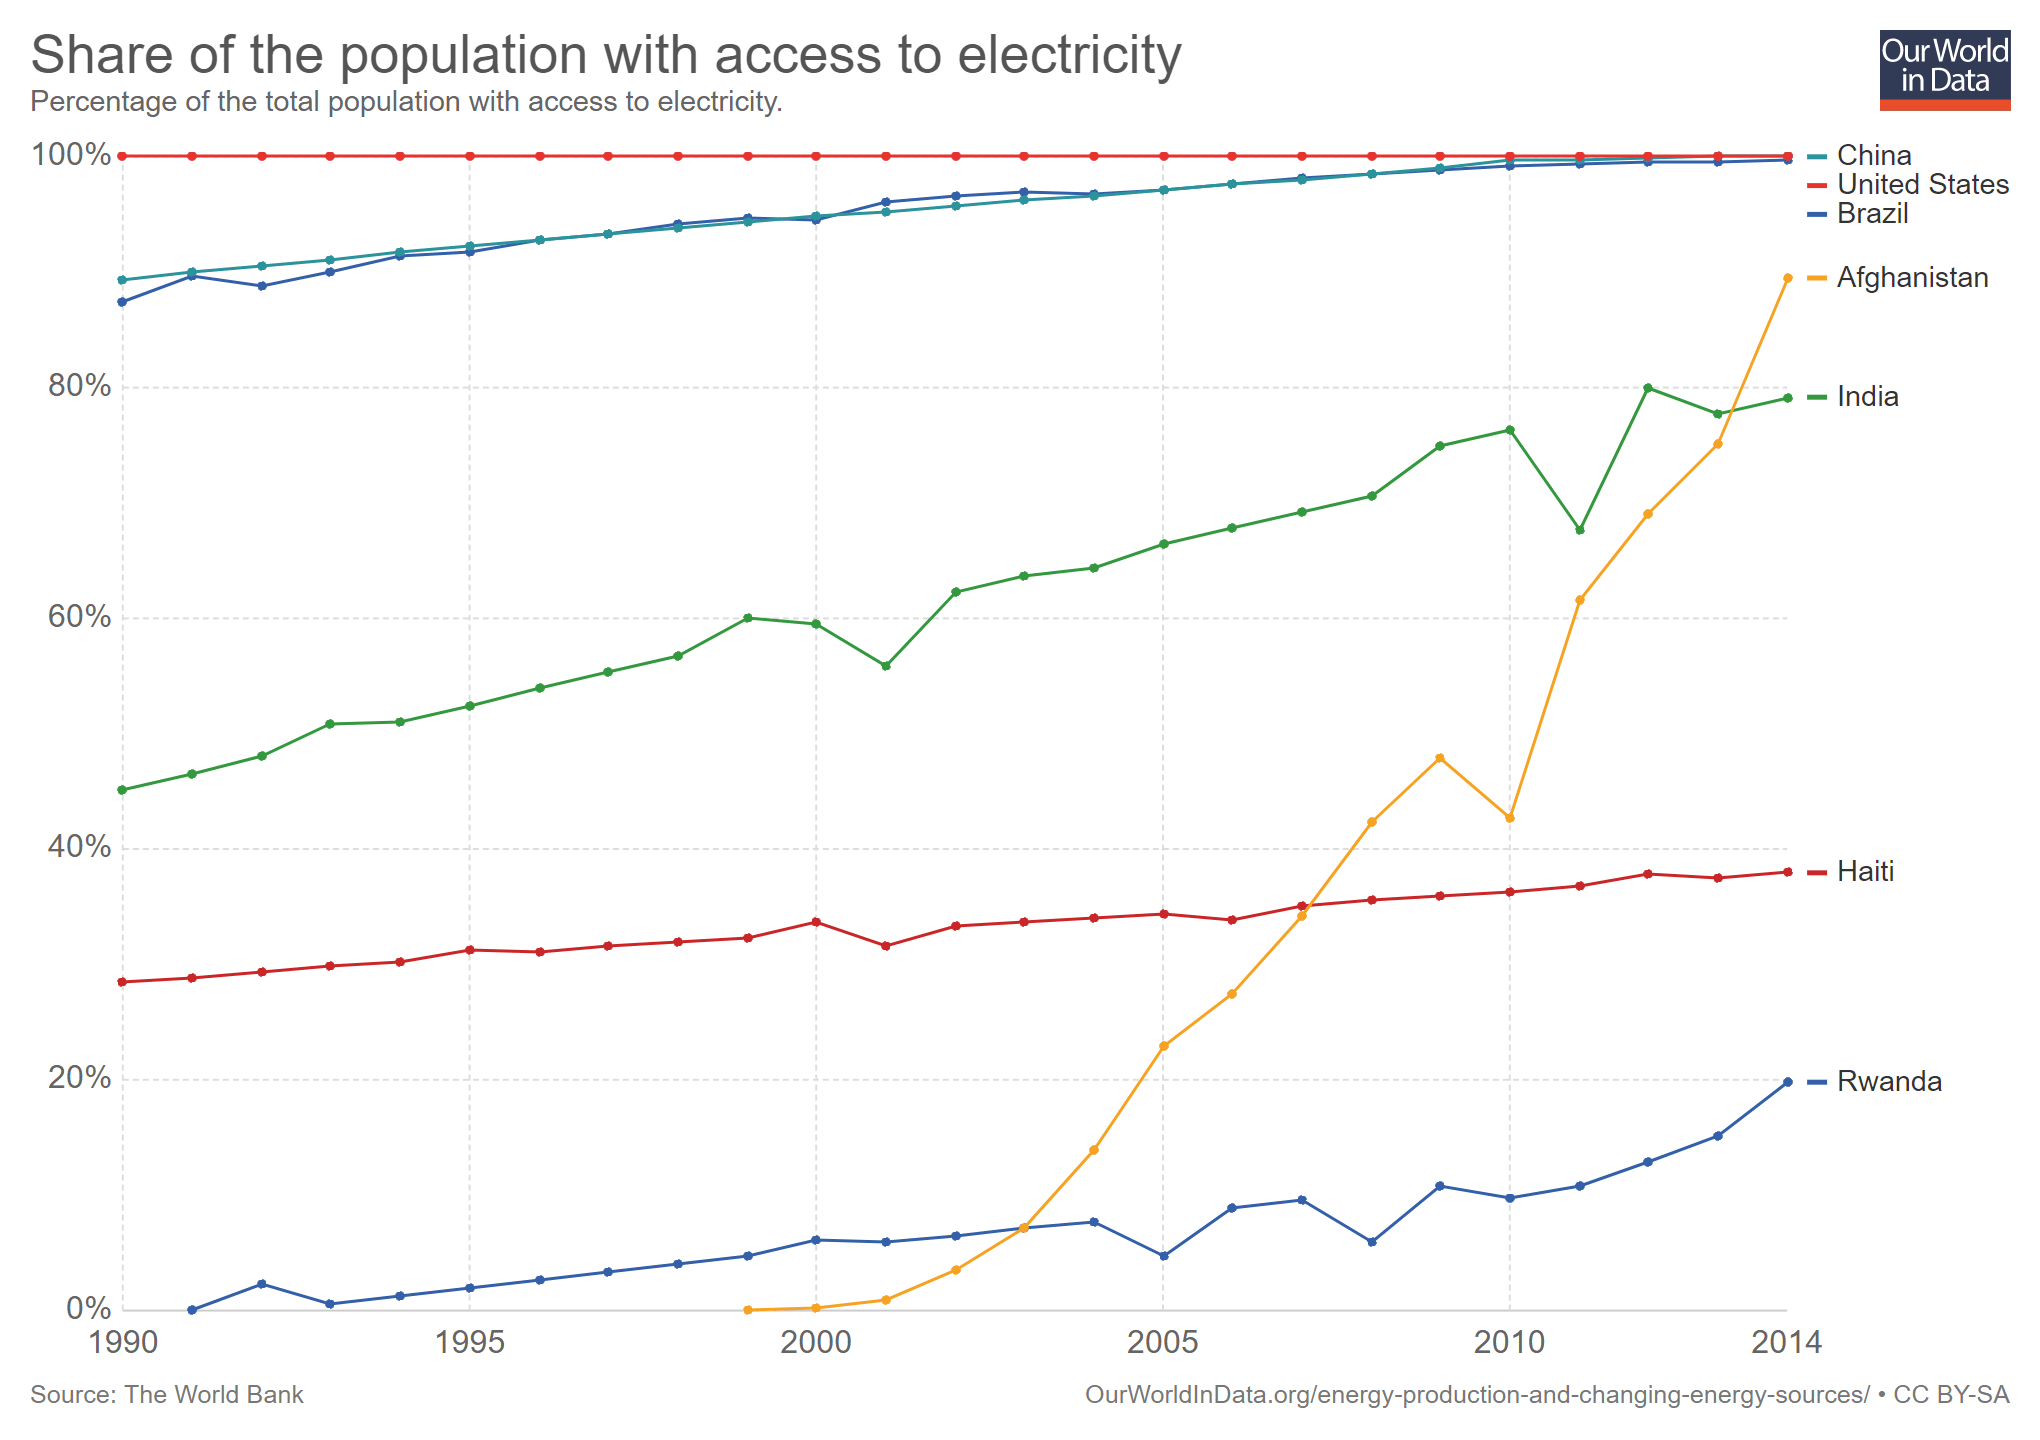
As you see above, India has gone from 45 percent access to electricity in 1990 to nearly 80 percent in 2014.
Afghanistan has seen an even more dramatic improvement, going from 0.16 percent of the population in 2000 to 89.5 percent of the population in 2014.
As renewable energy sources become cheaper and more accessible, we’ll reach total electrification.
Here too, we’re making great progress. In 2016, solar power grew faster than any other fuel source for the first time ever. Around the world, solar prices are still dropping.
The latest forecast from GTM Research reports prices of $2.07 per watt in Japan to $0.65 per watt in India, with prices dropping across hard and soft costs.
In 2017 alone, we saw wind power become cheaper than nuclear in the UK, with the cost of subsidies slashed in half since 2015.
As the BBC reports, during the UK’s 2015 subsidy auction, “offshore wind farm projects won subsidies between £114 and £120 per megawatt hour.” Just two years later, two firms committed to a guaranteed price of £57.50 per megawatt hour.
Looking stateside, the US Department of Energy announced in September 2017 that utility-scale solar has officially hit its 2020 cost targets three years early — with generation costs of $1 per watt and energy consumption costs of $0.06 per kilowatt-hour.
5. Food
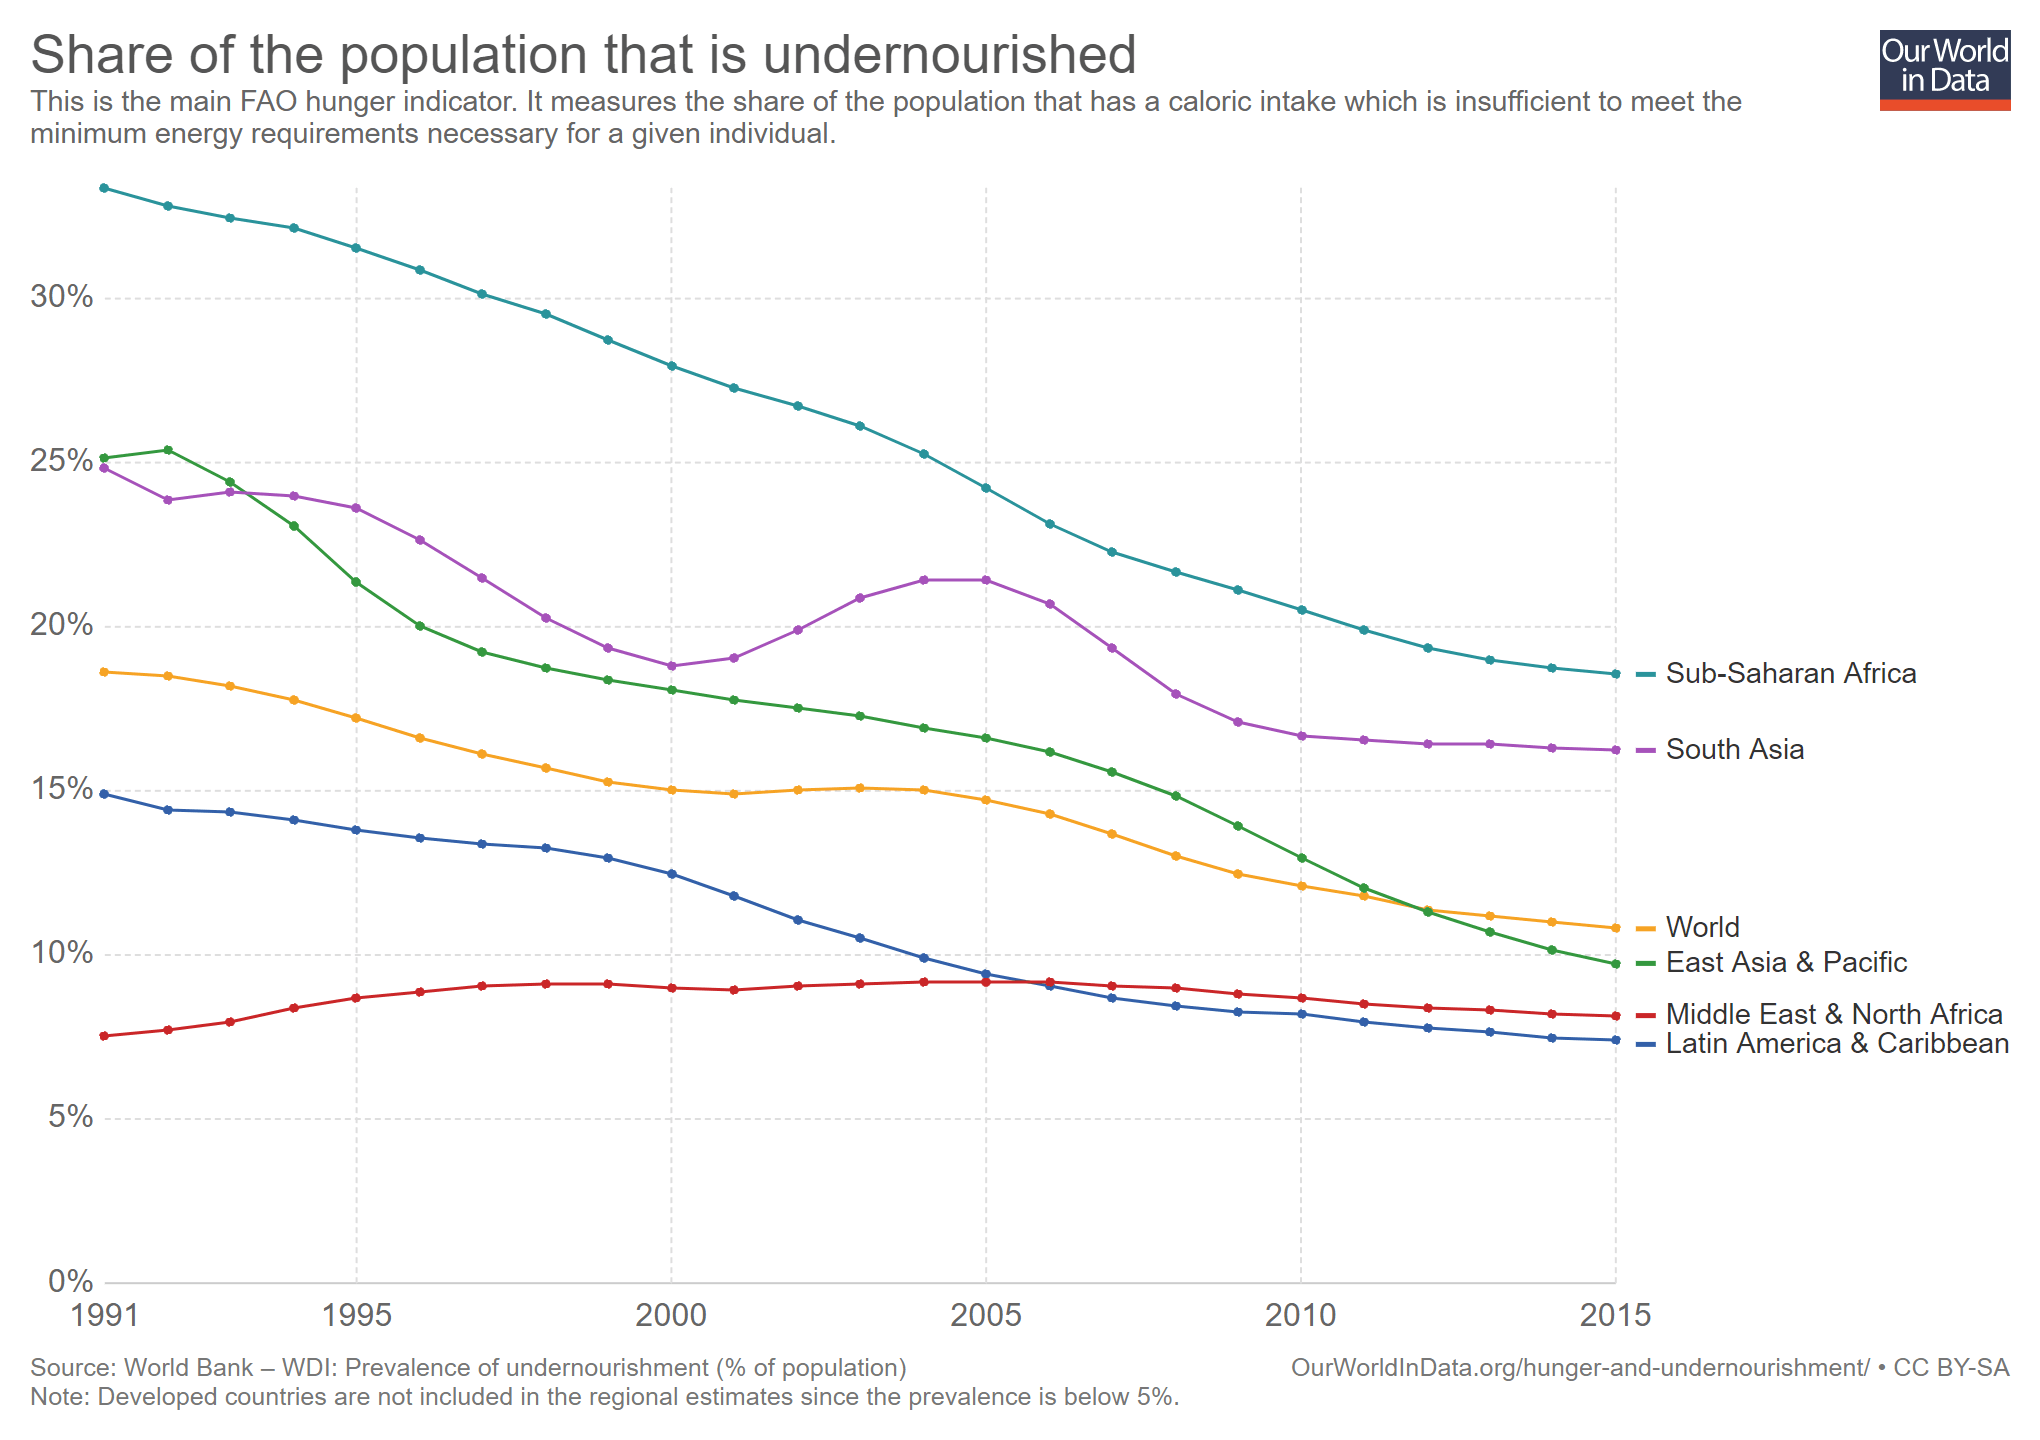
Despite the headlines, we’re making steady progress in the realm of food scarcity and hunger.
This graph features World Bank data on the percentage of the population that has an inadequate caloric intake. Globally, 18.6 percent of the population was undernourished in 1991; by 2015, it dropped to 10.8 percent.
Time and again, technology is making scarce resources abundant. I’ve written about bioprinted meat, genetically engineered crops, vertical farming, and agriculture robots and drones. Two more examples from 2017 so far:
- Human-Free Farms: In a 1.5-acre remote farm in the UK, Harper Adams University and Precision Decisions recently harvested their first crop of barley. The twist? The farm is run autonomously. Instead of human farm workers, Hands Free Hectare uses autonomous vehicles, machine learning algorithms and drones to plant, tend, and harvest.
- Food From Electricity: Another big idea in the fight against food scarcity and undernourishment comes out of Finland, where researchers are creating food from electricity. The team, formed of researchers from the Lappeenranta University of Technology (LUT) and the VTT Technical Research Centre of Finland, have created a machine that runs on renewable energy to produce nutritious, single-cell proteins. The system is deployable in a variety of environments hostile to traditional agriculture, and future iterations will be able to produce food anywhere, from famine-stricken deserts to space.
Looking at the data, we truly live in the most exciting time to be alive.
And if your mindset enables you to see problems as opportunities, the future is even more exciting than the present.
Join Me
Abundance Digital Online Community: I’ve created a digital/online community of bold, abundance-minded entrepreneurs called Abundance Digital.
Abundance Digital is my ‘onramp’ for exponential entrepreneurs — those who want to get involved and play at a higher level. Click here to learn more.
Resources
- U.S.: More wealthy people, fewer poor people. (Axiom)
- Economic output per person around the world over the last 2,000 years (Our World in Data)
- Finland: Digital money system for refugees (Medium)
- China to experiment with collecting taxes via blockchain (MIT Technology Review)
- Estonia considers ICO (Medium)
- Mortality inequality by nation (inequality of life expectancy) drops (Sam Peltzman)
- Teen births down 51% over last 10 years (Vox)
- Vital Statistics — Teen Births, 2016 (CDC)
- Teen pregnancy and childbearing (U.S. Department of Health & Human Services)
- First robot dental surgery (Engadget)
- FDA-Approved Gene Altering Treatment (NYTimes)
- Doctors use VR in life-saving treatment for conjoined twins (Washington Post)
- The Montreal Protocol is working (National Geographic)
- Impact of the Montreal Protocol (EPA)
- Annual number of deaths from natural disasters (Our World in Data)
- Wildlife — Drones used to track wild animal populations (MIT Technology Review)
- Reforestation — Bengaluru: Using Drones to plant forests (Your Story)
- Share of the population with access to electricity (Our World in Data)
- UK: Wind power cheaper than nuclear (BBC)
- US: Solar costs beat government goals by three years (Quartz)
- Solar costs are hitting jaw-dropping lows in every region of the world (Green Tech Media)
- Prevalence of undernourishment in developing countries (Our World in Data)
- Scientists make food from electricity (Futurism)
- UK: “Hands-Free Hectare” robot farm plants, oversees harvests barley without humans (Digital Trends)
Image Credit: Romolo Tavani / Shutterstock.com