Google Public Data Explorer Turns Boring Statistics into Amazing Videos of Graphs

Share
Type "unemployment rate California" into Google and you'll notice a little graph pops up in the search results. That graph is part of a Google Tool called Public Data which was introduced last year to give you access to tons of public information in a handy chart form. Now, Google is upping the ante by launching the Public Data Explorer, a tool that lets you see public statistics as they evolve over time. Unemployment, life expectancy, cancer rates - it's all there to enjoy. PDE can give you the statistics over time in boring line graphs or you can opt for some really cool looking videos of bar graphs and maps. Better yet, you can then link to those videos or embed them in your blog. Pretty slick. We've got a few examples for you below. PDE is a good example of how analytical tools for data must improve as the amount of digital data swells in the future.
The amount of data you'll be expected to manage has already expanded, and it's likely to continue to grow exponentially. You've got health information from body monitors, social networks & news feeds, videos and pictures of your life, and many others data streams. Professional groups, like doctors or soldiers, will have even more data to deal with. That flood has to be managed, and eventually analyzed if it's ever to make a positive impact on our lives. Public Data Explorer is just one utility to better understand what the information stream is actually telling us. Eventually, these sorts of tools will become more complex and actually suggest which actions we should take. There's already software like that being made for doctors and at some point it could be a necessity for everyone.
Google PDE is based on the Public Data tool we've seen before:
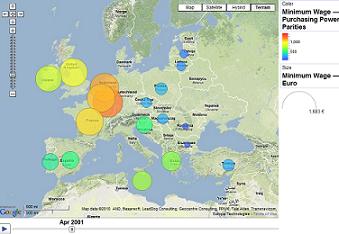
Additional sources of data have now been included to expand the range of what Google can show you in a nifty graph. PDE includes information from the US Bureau of Labor, the US Census Bureau, World Bank, the US Bureau of Labor Statistics, the Organization for Economic Co-operation & Development, the California Department of Education, Eurostat, the US Center for Disease Control, and the US Bureau of Economic Analysis. As impressive as that range of data may be, the way that it is displayed is even more so. My favorite option is watching variables change over time on a map, as seen in this graph of the minimum wage in Europe:
Be Part of the Future
Sign up to receive top stories about groundbreaking technologies and visionary thinkers from SingularityHub.

There are also more traditional line and bar graphs. What's really awesome is being able to select and highlight individual portions of the graph as it evolves. For instance, watch how cell phone service has evolved in different parts of the world. Seeing the tags move back and forth gives you a real sense of what's happened:
You can manipulate either of these graphs on your own. All you need to do is click "explore data" and you'll be taken to the PDE site with the graph already queued up. Feel free to explore the options for a while, you'll get hooked.
Considering all the data now on tap, Google PDE can still feel a little limited. Partially because it's such a good tool you want to apply it to everything. Also, Google is restricted by those agencies which agree to share their public data. To some degree, Google may have shaped PDE based on the searches performed with Public Data. In the recent Google blog post, Jürgen Schwärzler describes the top search types for Public Data. Heading the list were school comparisons, unemployment, and population. You can find a complete list on this PDF (caution: starts download).
The ability to craft your own graphs based on reliable public data, then link to or embed them, is a boon for people who love statistics. Very soon, we may all be one of those people. The more access we have to information, and the better we can analyze and present it, the more we will see real benefit from that information. These sorts of analytical tools, whether they come from Google, or Wolfram Alpha, or another company, are key because everything is becoming information. Robots, AI, computing, these things are clearly moving to information technology. But so is your brain thanks to the Blue Brain Project. Genetics is becoming IT - we're engineering and programming cells. Everything is either imbued with digital data or is shaped from it. Tools like PDE are relatively simple now, but as they expand they will become a vital part of conquering the flood of data instead of drowning in it.
[screen capture and video credits: Google]
[source: Google Blog, Google Tools, Google Labs]
Related Articles

These Mini Brains Just Learned to Solve a Classic Engineering Problem

Brain Implants Let Paralyzed People Type Nearly as Fast as Smartphone Users

Hackers Are Automating Cyberattacks With AI. Defenders Are Using It to Fight Back.
These Mini Brains Just Learned to Solve a Classic Engineering Problem
Brain Implants Let Paralyzed People Type Nearly as Fast as Smartphone Users
Hackers Are Automating Cyberattacks With AI. Defenders Are Using It to Fight Back.
What we’re reading