Are Nations Less Important Than Phone Calls? New MIT Map Redraws The U.S. According to Communication

Share

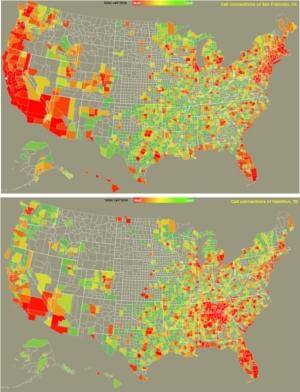
Who we talk to may be a better measure of how to draw our maps than the arbitrary lines laid down by history. MIT's Senseable City Lab has used hoards of data compiled by telecommunications giants like AT&T to craft a map of how the United States is linked. The Connected States of America redraws the nation according to talk times and number of SMS texts, giving us new regions that mirror our traditional states while yielding new surprises. "Sister states" like Georgia-Alabama or Mississippi-Louisiana emerge, tightly tied together by their conversations. While others, like California, become divided between major city centers. It's a dynamic new way of viewing the world, perhaps a POV that is closer to the reality of our new century. Check out the brief overview of the project in the video below. The future of geography may be more about who you know than where you are.
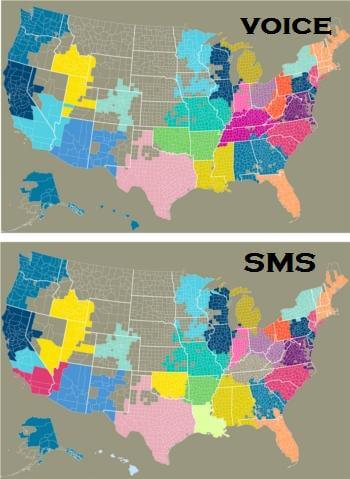
Regionalism is nothing new. The fact that people in the South call other southern cities shouldn't be a surprise, nor should it shock you that LA and NYC seem to be tied together despite their distance. Common locations, culture, and industries have long dominated our communications as well as our borders. What the Connected States of America maps show, however, is that our understanding of those connections needs to become much more nuanced as our tech-rich civilization continues to evolve. There's so much we don't quite understand about how people are tied together because of (and despite) borders, but the MIT data hints at some amazing questions to ask. Why does California divide itself into two regions (around LA and San Francisco) while Texas holds together despite similar metropolitan splits between Dallas-FortWorth and Houston? Why is Chattanooga more closely tied with Georgia and Alabama than the rest of Tennessee?
Already, the Senseable City Lab understands some of the patterns they've seen. SMS text messages are disproportionately used among younger generations, and as such creates smaller regions associated with less traveling. Indeed, SMS texts are less likely to be used to communicate with people over long distances, period.
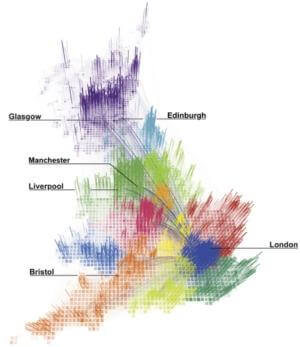
Researchers from MIT used similar techniques as those seen in the Connected States of America to analyze 12 billion communication records in the UK (representing more than 95 percent of residential and business landlines). The study, published in the end of 2010, demonstrated that communication divisions were actually better indications of population cohesiveness than political boundaries. Interestingly, mapping the nation according to phone calls defies some boundaries while reinforcing others. Scotland spent just 23.3% of its call time out of the region (compared to 37% on average). In other words, if you starting chopping up the UK, Scotland would probably be okay with it in a way that Wales or Southern London would not. In fact, the researchers can quantify such a hypothetical division as "approximately twice more disruptive on Wales than Scotland."
The applications for this kind of data could be extraordinary. Marketing efforts (corporate or political) could better target their audiences according to their shared lines of communication rather than their standard geography. Regions that have heavy communication ties to multiple sister regions could become strategic launching sites for all kinds of endeavors, from sales to military invasions. As we better understand the way areas are linked, we may be able to form commercial, political, and cultural alliances that perform better than ones based purely on traditional geography. Any way that we choose to divide and identify ourselves has lasting impact on the globe, and if communication links come to augment (or even supplant) political ones we could see big changes in the shape and strength of nations.
Be Part of the Future
Sign up to receive top stories about groundbreaking technologies and visionary thinkers from SingularityHub.

In the short term, one of the lasting (but understated) impacts of MIT's Connected States of America research is the clear sign of the rising importance of metropolitan centers. The majority of data shows urban hubs as defining marks of how we communicate. Effectively, much of New Jersey might as well be NYC, and parts of Nevada belong to Los Angeles. As urban centers continue to pull in the global population, the future of humanity looks to be dominated by mega-cities. Just as California is effectively divided by its metropolises, we may see splits in China around their upcoming mega-urban centers. If China wishes otherwise, it may need to understand how to unite the communications of these cities to maintain a national cohesion.
In the end, the Connected States of America is another beautiful example of how marrying data and maps is giving us so much insight into our modern world. Digital maps, laden with endless streams of demographic information and social media, are quickly becoming powerful and respected tools in science. MIT's look at communication connections is just one more drop in a torrent of geo-focused analysis. Once we learn how to harness that flow we're going to have a much better chance of understanding and shaping our future.
*Data from the CSA project is freely available from MIT.
**Note: "All communication data was aggregated by county, determined by the caller's and recipient’s most frequently used cell tower, which was assumed to be near their residence. In order to determine which counties are connected most closely by communications, researchers analyzed anonymized location data for both ends of the calls and texts. No personal information was used." --MIT Senseable City Lab, CSA project press page
[image and video credits: Senseable at MIT]
Source: senseable city lab, ratti et al. (2010) redrawing the map of great britain from a network of human interactions. plos one
Related Articles

OpenAI Agent Breaks Free and Hacks Hugging Face

This DNA Switch Could Control Molecular Machines

Orbital Data Centers Are Seductive on Paper, but They Face Daunting Challenges in Reality
OpenAI Agent Breaks Free and Hacks Hugging Face
This DNA Switch Could Control Molecular Machines
Orbital Data Centers Are Seductive on Paper, but They Face Daunting Challenges in Reality
What we’re reading