How to Perfect VR Storytelling? Measure What People Watch

Share
We go to the movies to immerse ourselves in film. Cinematic surround sound, huge high-definition screens, total darkness. But it’s not full immersion. To really step into a movie, you need virtual reality, and filmmakers are just now experimenting with what that means.
If you’ve experienced immersive 360° video you probably know there’s an immediately noticeable problem. Where should you look to spot the action? Instead of serving up a single point of view—VR’s strength and weakness is the freedom to look up, down, left, and right.
This delivers an amazing sense of presence, but it also means viewers may miss key action. And this is where better data and analytics—measuring what viewers look at and watch—will prove an indispensable tool for VR content creators.
At Greenlight VR, we think content will require analytic tools and insights into the user’s experience to maximize feelings of presence. Previously, these analytic tools and insights remained untouched beyond academic laboratories, but we’re now gathering leading analytic developers, providers, and academics to discuss the winning attributes every piece of VR content should have in 2016 and beyond. And it isn’t just content—better data will help new VR adopters choose the right hardware to watch their favorite VR stories too.
Here are three case studies outlining the necessity of data analytics for virtual reality.
Learning to Direct Viewer Attention With Heat Maps
One key requirement for a 360° video or immersive VR experience is direction—and it is also one of the most difficult aspects to control. Directing a user’s gaze is essential if they’re to follow a scripted experience, initiate a key trigger event in a virtual game, and maintain focus. Developers are compensating by utilizing automatic reorientations and cues to redirect the user’s gaze. However, this can only solve maybe half the problem.
With heat maps, qualitative information about visual processing can be easily visualized and communicated. Today, heat maps are typically generated for 2D stimuli presented on a computer display. However, mapping visual attention on stimuli from a three-dimensional virtual environment is not straight forward, and the process is not well understood.
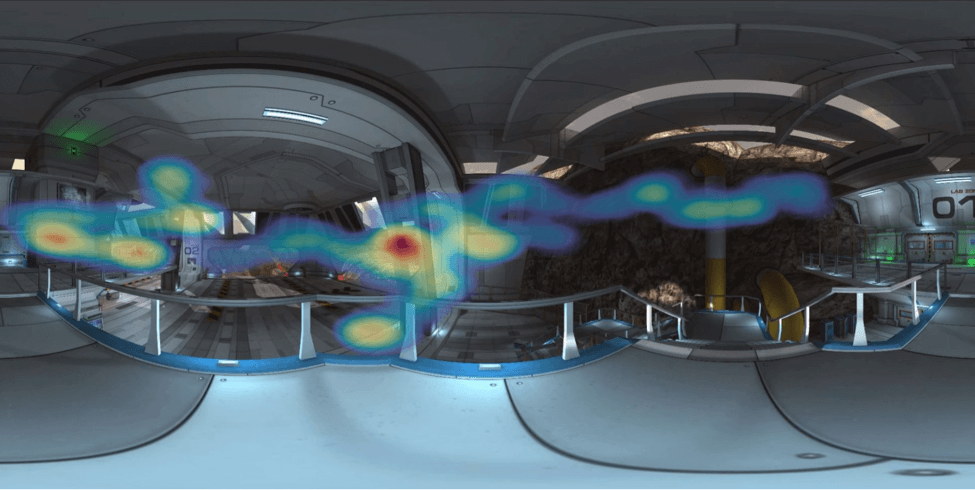
Source: Retinad VR
Retinad VR, a VR analytics platform company, is already working this problem.
“With a dedicated analytical platform, Retinad provides filmmakers and developers the opportunity to understand how users interact with their virtual reality applications. This knowledge can help unlock the creative process and advance virtual reality as a medium,” says Alexander Haque, Retinad’s director of developer relations.
Big Data Can Help Cinematographers Create Better 360° Videos
Heat maps are not the only data that help us understand viewer engagement in VR. We also want to know which content, as a whole, draws viewers in and keeps them coming back. Measuring engagement in VR is just as important as it is in other mediums, like online video.
Jaunt has been tackling this issue regarding the repeatability of cinematic VR. In an interview with eMarketer, Jaunt’s chief business officer David Anderman went further saying:
“There are many different measures and statistics that apply to online video these days. It’s a well-developed field. The same thing applies to cinematic VR. It’s the same basic metrics in terms of understanding what content people look at, what kinds of videos they want to see, how much of it they watch and when they drop out. We also look at repeatability, and we’ve had fantastic results. It’s content that people watch again and again and again. For online video, that’s a great measure of how successful it is.”
He would go on to state how the number of views a 360° video receives is important but not necessarily indicative of an enjoyable or repeatable experience. That is why they employ data-intensive analysis to determine what quality cinematic VR experiences look like.
Be Part of the Future
Sign up to receive top stories about groundbreaking technologies and visionary thinkers from SingularityHub.

Benchmarking Will Help Us Choose the Right Hardware
In the PC gaming community, hardware is key. The same is true for virtual reality, and a discussion has been raging about what constitutes a VR-certified PC configuration.
With slight but arguably impactful distinctions between the hardware requirements for both the Oculus Rift and HTC Vive, there is significant room for user error when building a VR capable PC. That’s why the industry needs benchmarking to provide a clearer picture of what’s inside each of these headmounted VR displays.

VR headset comparison. Source: Futuremark
Futuremark, the global software development company that produces computer benchmark applications, unveiled VRMark, the first benchmarking suite specific to virtual reality HMDs. By utilizing both public and manufacturer-provided specifications, VRMark users can understand exactly what’s inside each HMD. The uniqueness of VR headsets requires new technical specifications, such as field of view (FOV) and refresh rate, both of which are particularly important for users to know.
Why Analytics Matters Now
Any new medium will bring new challenges. But today new analytics tools can help VR overcome early shortcomings using real insights from the users. As designers continue working to minimize discomfort and inattentiveness and maximize presence and focus—it’s key the industry not overlook the ocean of data at their fingertips.
To learn more about big data and analytics for virtual reality and hear from executives of Jaunt, Futuremark, and Retinad, join the discussion at the 2016 Virtual Reality Analytics Web Summit from anywhere in the world on March 16th.
Image credit: Shutterstock.com
Related Articles

This DNA Switch Could Control Molecular Machines

These Seven AI Rings Translate Sign Language in Real Time

AI Companies Are Betting Billions on AI Scaling Laws. Will Their Wager Pay Off?
This DNA Switch Could Control Molecular Machines
These Seven AI Rings Translate Sign Language in Real Time
AI Companies Are Betting Billions on AI Scaling Laws. Will Their Wager Pay Off?
What we’re reading