Why Most of Us Fail to Grasp Coming Exponential Gains in AI

Share
By now, most of us are familiar with Moore’s Law, the famous maxim that the development of computing power follows an exponential curve, doubling in price-performance (that is, speed per unit cost) every 18 months or so. When it comes to applying Moore’s Law to their own business strategies, however, even visionary thinkers frequently suffer from a giant “AI blind spot.”
I give a lot of talks to successful, strategically-minded business people who can see around corners in their own industries, yet they struggle to grasp what exponential improvement really means. And a lot is riding on this exponential curve, but one technology that is particularly benefiting from it is artificial intelligence.
Capturing Exponential Curves on Paper
One reason people do not grasp how rapidly artificial intelligence is developing is so simple it’s almost laughable: Exponential curves don’t fare well when we humans try to capture them on paper. For very practical reasons, it’s virtually impossible to fully depict the steep trajectory of an exponential curve in a small space such as a chart or a slide. Visually depicting the early stages of an exponential curve is easy. However, as the steeper part of the curve kicks in and numbers rapidly get larger, things get more challenging.
To solve this problem of inadequate visual space, we use a handy math trick known as a logarithm. Using what’s known as a “logarithmic scale,” we learned to squish exponential curves into submission.
Unfortunately, the widespread use of logarithmic scales can also cause myopia.
The way a logarithmic scale works is that each tick on a vertical y-axis corresponds not to a constant increment (as in a typical linear scale), but to a multiple, for example a factor of 100. The classic Moore’s Law chart below (Chart 1) uses a logarithmic scale to depict the exponential improvement in the cost of computing power (measured in calculations/second/dollar) over the past 120 years, from mechanical devices in 1900 to today’s powerful silicon-based GPUs.
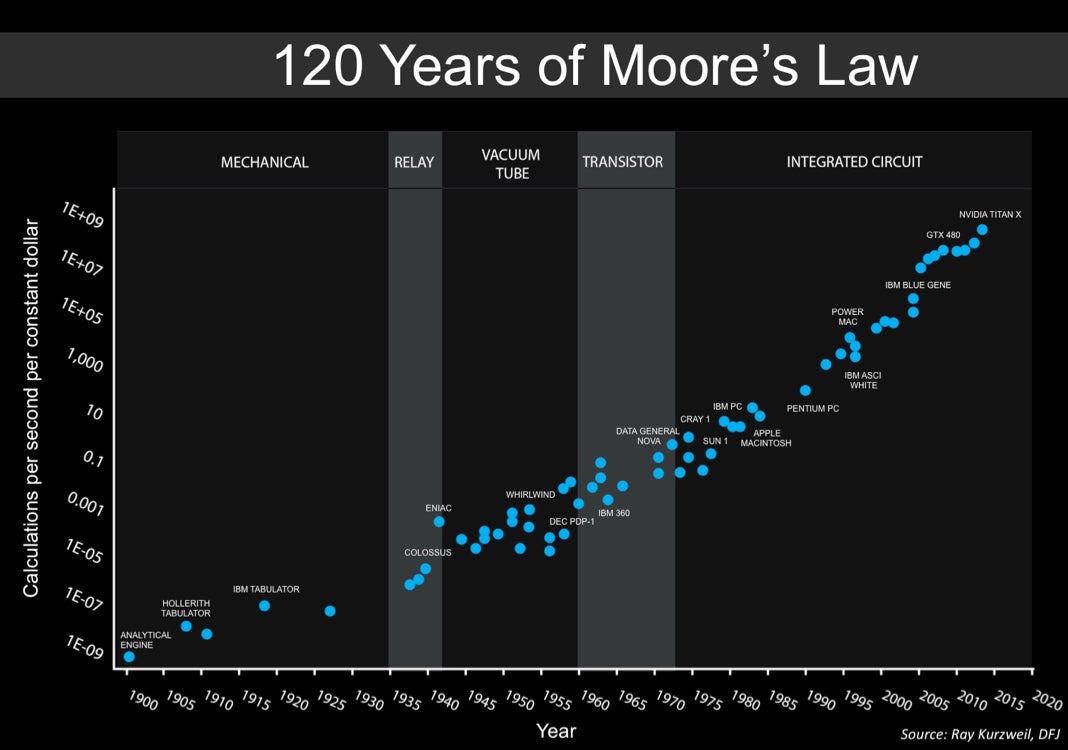
Chart 1: Exponential improvements in the cost of calculation on a logarithmic scale. Source: Data provided by Ray Kurzweil and updated by DFJ (via Wikimedia Commons)
Now, logarithmic charts have served as a valuable form of shorthand for people who are cognizant of the visual distortion they introduce. In fact, a logarithmic scale is a handy and compact way to depict any curve that rises in a rapid and dramatic fashion over time.
However, logarithmic charts carry a huge, hidden cost: they fool the human eye.
By mathematically collapsing huge numbers, logarithmic charts make exponential increases appear linear. Because they squash unruly exponential growth curves into linear shapes, logarithmic charts make it easy for people to feel comfortable, even complacent, about the speed and magnitude of future exponential gains in computing power.
Our logical brain understands logarithmic charts. But our subconscious brain sees a linear curve and tunes out.
So, what’s an effective way to undo some of the strategic myopia caused by logarithmic charts? Part of the solution lies in going back to the original linear scale.
On Chart 2 below, I used the data to fit an exponential curve and then plotted it using a linear scale on the vertical axis. Once again, the vertical axis represents the processing speed (in gigaflops) that a single dollar can purchase, and the horizontal axis represents time. However, in Chart 2, each tick on the vertical axis corresponds to a simple linear increase of just one gigaflop (rather than an increase of a factor of 100 as in Chart 1). The term “FLOP” is a standard way to measure computing speed, meaning floating-point operations per second, hence FLOPS, megaFLOPS, gigaFLOPS, teraFLOPS, and so on).
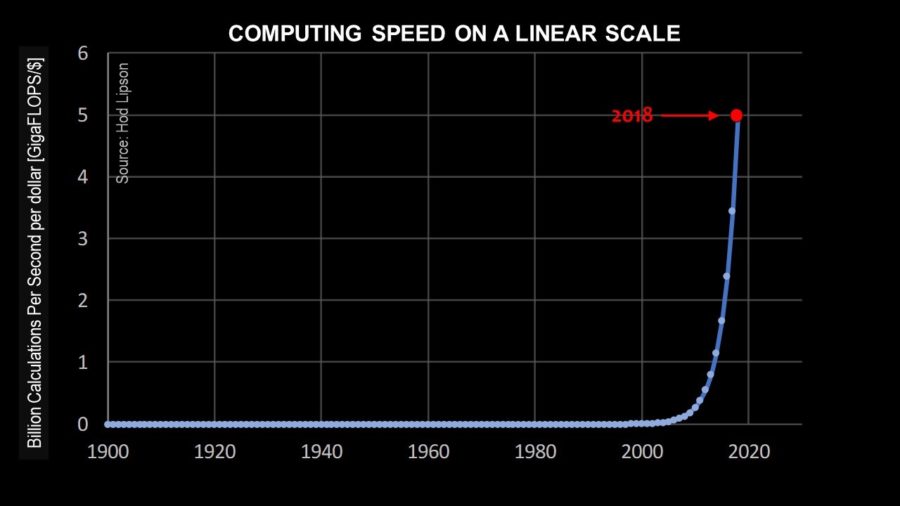
Chart 2: Moore’s Law depicted on a linear scale
Chart 2 shows the actual, real exponential curve that characterizes Moore’s Law. The way this chart is drawn, it’s easy for our human eyes to appreciate how rapidly computing price performance has increased over the past decade.
Yet, there’s something terribly wrong with Chart 2. To a naïve reader of this chart, it would appear as if over the course of the 20th century, the cost and performance of computers did not improve at all. Clearly, this is wrong.
Chart 2 shows how using a linear scale to demonstrate Moore’s Law over time can also be quite blinding. It can make the past appear flat, as if no progress has taken place until only very recently. In addition, the same linear-scale chart can also lead people to incorrectly conclude that their current vantage point in time represents a period of unique “almost vertical” technological progress.
This point leads me to the next major cause of chart-induced AI blindness: linear-scale charts can fool people into believing they live at the height of change.
Be Part of the Future
Sign up to receive top stories about groundbreaking technologies and visionary thinkers from SingularityHub.

The Myopia of Living in the Present
Let’s take another look at Chart 2. When viewed from the year 2018, the previous doublings of price-performance that took place every decade throughout most of the 20th century appear flat, almost inconsequential. A person looking at Chart 2 might say to themselves, “Boy, am I lucky to be living today. I remember the year 2009, when I thought my new iPhone was fast! I had no idea how slow it was. Now I’ve finally reached the exciting vertical part!”
I’ve heard people say that we have just passed the “elbow of the hockey stick.”
But there is no such transition point.
Any exponential curve is self-similar—that is, the shape of the curve in the future looks the same as it did in the past. Below, Chart 3 again shows the exponential curve of Moore’s Law on a linear scale, but this time from the perspective of the year 2028. The curve assumes that the growth we have experienced in the past 100 years will continue for at least 10 more years. This chart shows that in 2028, one dollar will buy about 200 gigaflops of computing power.
However, Chart 3 also represents a potential analytical quagmire.
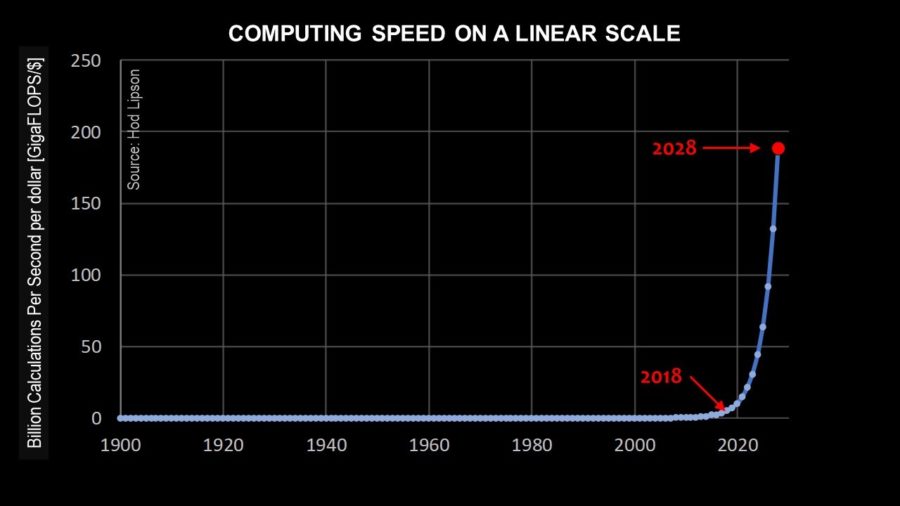
Chart 3: Moore’s Law on a linear scale
Look closely at where today’s computing power (the year 2018) lies on the curve depicted in Chart 3. From the vantage point of a person living and working in the future year 2028, it would appear that there was virtually no improvement in computing power even over the course of the early 21st century. It looks like computing devices used in the year 2018 were just a tiny bit more powerful than those used, say, in 1950. An observer could also conclude that the current year, 2028, represents the culmination of Moore’s Law, where progress in computing power finally takes off.
Every year, I could re-create Chart 3, changing only the timespan depicted. The shape of the curve would be identical, only the ticks on the vertical scale would change. Note how the shape of Charts 2 and 3 looks identical, except for the vertical scale. On each such chart, every past point would be flat when viewed from the future, and every future point would appear to be a sharp departure from the past. Alas, such mis-perception would be the path to flawed business strategy, at least when it comes to artificial intelligence.
What Does This Mean?
Exponential rates of change are difficult for the human mind to comprehend and for the eye to see. Exponential curves are unique in the sense that they are mathematically self-similar at every point. What this means is that an ever-doubling curve has no flat part, no ascending part, and none of the “elbow” and “hockey stick” bends many business people are used to talking about. If you zoom in on any portion in the past or the future, its shape looks identical.
As Moore’s Law continues to make itself felt, it’s tempting to think at this very moment we’re reaching a unique period of great change in the development of artificial intelligence (or any other technology that rides on Moore’s Law). However, as long as processing power continues to follow an exponential price-performance curve, each future generation will likely look back on the past as an era of relatively little progress. In turn, the converse will also remain true: each current generation will look 10 years into its future and fail to appreciate just how much advancement in artificial intelligence is yet to come.
The challenge, then, for anyone planning for a future driven by computing’s exponential growth is fighting their brain’s flawed interpretations. Hard as it may sound, you need to hold all three charts in your mind at once—the visual consistency of the logarithmic chart and the drama but deceptive scale of the linear charts—to truly appreciate the power of exponential growth. Because the past will always look flat, and the future will always look vertical.
Image Credit: Mauro Carli / Shutterstock.com
Related Articles

OpenAI Agent Breaks Free and Hacks Hugging Face

Scientists Inch Closer to Creating Human Sperm in the Lab

Anthropic Says Chatbots Have What May Be a Key Feature of Consciousness. Are They Right?
OpenAI Agent Breaks Free and Hacks Hugging Face
Scientists Inch Closer to Creating Human Sperm in the Lab
Anthropic Says Chatbots Have What May Be a Key Feature of Consciousness. Are They Right?
What we’re reading