These Maps Reveal the Profound Progress and Peril of Modern Civilization

Share
Today's mega-threats are systemic and interconnected. The growing demand for energy and meat helps explain the steady rise in carbon and methane emissions. Coal-belching factories and burning forests are in turn speeding up global warming, increasing the frequency of storms, deepening food insecurity, and imperiling flood-prone cities. The interdependent nature of our biggest challenges and most promising solutions is hard to conceive. Maps can help bring clarity to complexity. What’s more, our human brains are hardwired to engage with them. By providing new perspectives, they can also help reframe seemingly intractable problems.
More than ever, our future seems volatile and uncertain. In Terra Incognita: 100 Maps to Survive the Next 100 Years, we use maps to explain the multi-faceted impacts of our modern civilization. In the process, we reveal the footprint of everything from the melting of the glaciers to extractive mining of rare earths. Maps provide a reminder of the uneven nature of our progress and the fragility of our planet and its ecosystems. But they do more than this. They can also provide a roadmap for action. Satellite images, especially when layered with additional data, offer insight into how we are changing the planet and paths to a more sustainable future.
A Case for Informed Optimism
Maps reveal the extraordinary progress we have made in extending life expectancy, improving maternal health, and reducing extreme poverty.
One of the most impressive gains is in the area of education. A glance at maps displaying mean years of schooling around the world in 1950 and 2017 highlights remarkable improvements in Latin America and the Caribbean, Africa, Eastern Europe, and Asia. The improvements in education are breathtaking. In 1950, less than half of humanity had a formal education. By 2050, a century later, most of the world will have acquired at least secondary education.
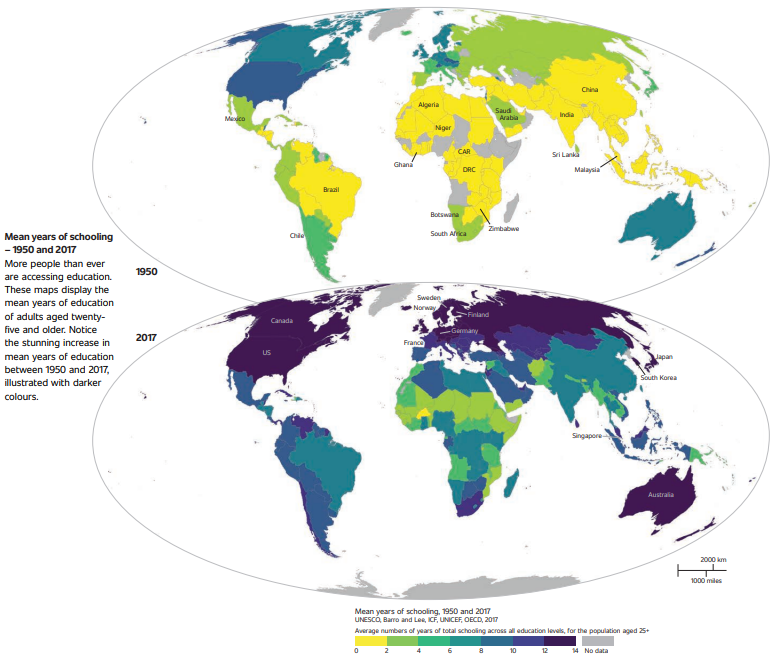
But all is not well. There are still 120 million children out of school and over 600 million youth who cannot read and write. Despite increasing literacy globally, over 770 million adults are still illiterate. What's more, today's education systems need to be rapidly upgraded for tomorrow's job market.
Climate Crisis and a Green Lining
The realities of climate change are becoming terrifyingly apparent by the year. The origins of this change are also clear: more greenhouse gases were emitted in the last 30 years than the previous 130. This is because the world is burning more fossil fuels, cutting down more forests, increasing meat consumption, and using more fertilizers than ever.
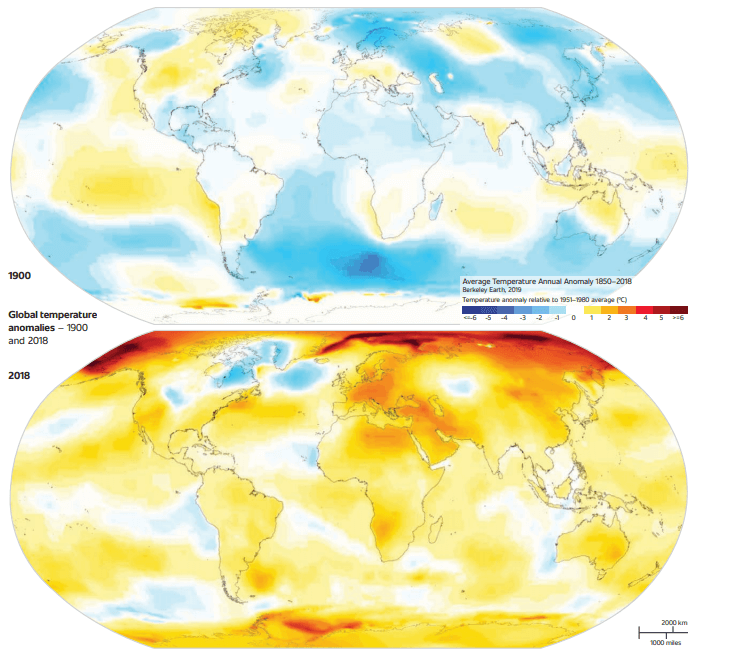
Maps show how just a handful of countries are responsible for most emissions. In the 1980s, the US and Western Europe were the biggest culprits. Today, China releases more greenhouse gases than the US, EU, and Russia combined. There are other culprits too, including Australia, Canada, India, Japan, Mexico, and Saudi Arabia. Meanwhile, just 100 companies extract, process, sell, and use the fossil fuels behind roughly 70 percent of global emissions.
If there’s any green lining, it's that the world appears to be on the cusp of a climate action tipping point. While COP26 did not go nearly far enough, there are signs of real action on achieving zero carbon and zero deforestation in the coming decades. There is also growing pressure on governments to be more ambitious. Civic movements such as Friday for Futures and the Extinction Rebellion are advocating for real change. Investor and consumer activism is also increasing, with notable recent victories against Exxon, Chevron, and Shell. Investors with assets of trillions are demanding that governments speed up action on decarbonization, and not a moment too soon.
The Urban Boom Continues
Massive urbanization is another global trend featured in Terra Incognita. The sheer dimensions of today’s cities are unlike anything we’ve ever witnessed. In 1950, there were just three cities with ten million residents or more. Today, there are over 30 and another 500 cities with one million people or more. These cities are key nodes in the global financial architecture and pivotal to the functioning of supply chains. Just a few hundred of them account for over two thirds of global GDP.
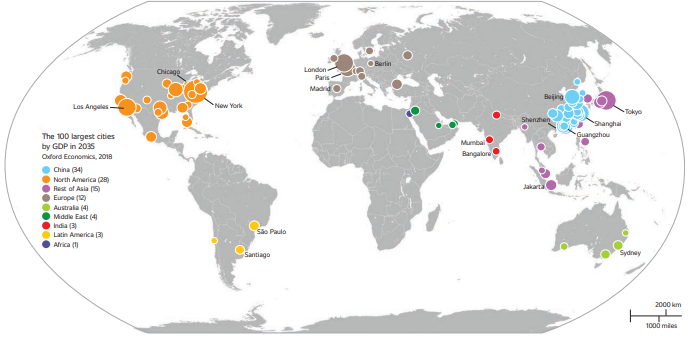
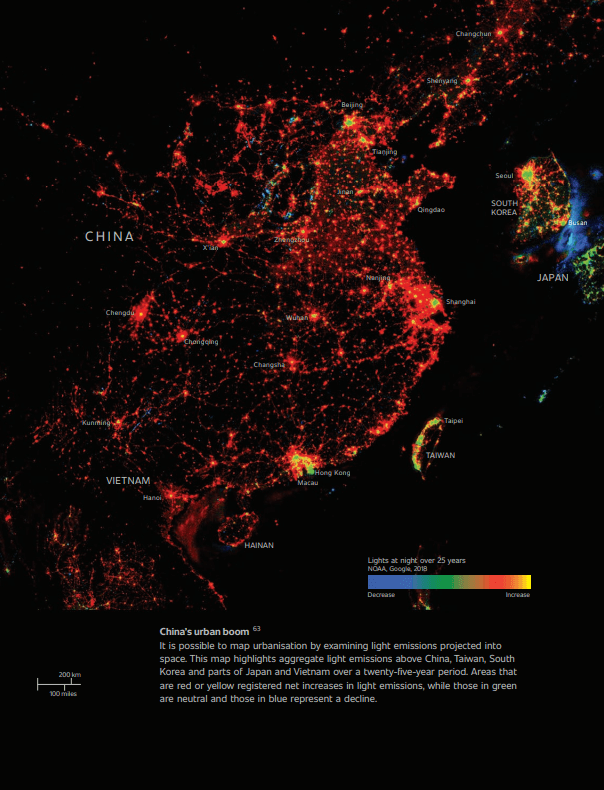
The rapid expansion of cities, especially in the Americas, Africa, and Asia, is a forcing function for the international system. When fully recognized nation states emerged in the 17th century, less than one percent of the world lived in a city. Today, more than 55 percent of people are urban, and by 2050, the proportion will rise to almost 70 percent. Cities are exerting diplomatic overtures and forging alliances—over 300 of them—to channel their interests.
Technological Revolution
Cities, companies, and citizens are also increasingly digitized. Today, there are over 4.6 billion active internet users, up from 3.9 billion in 2019. Over 60 percent of all inhabitants on Earth are connected to some digital device. The Covid-19 pandemic underlined the critical importance of connectivity and the fact that data, more than ever, is the most important strategic asset of the 21st century.
The extraordinarily rapid spread globally of the benefits of the digital revolution is depicted in the maps. But so too is the growing digital divide. For all its promise, this technological revolution can deepen inequality, increase gender biases, and much more. The need to leapfrog and harness digital transformation is evident, as is the need to spread the benefits of other technologies, including vaccines and clean energy.
Several maps featured in Terra Incognita illustrate the material form of our increasingly digital world. The internet, cloud computing, artificial intelligence, and 5G are giving rise to highly integrated networks and connected systems crisscrossing the planet. And with billions of new devices being added to these systems a year—some 75 billion in total by 2022—maps can also help remind us how the attack surface is expanding exponentially.
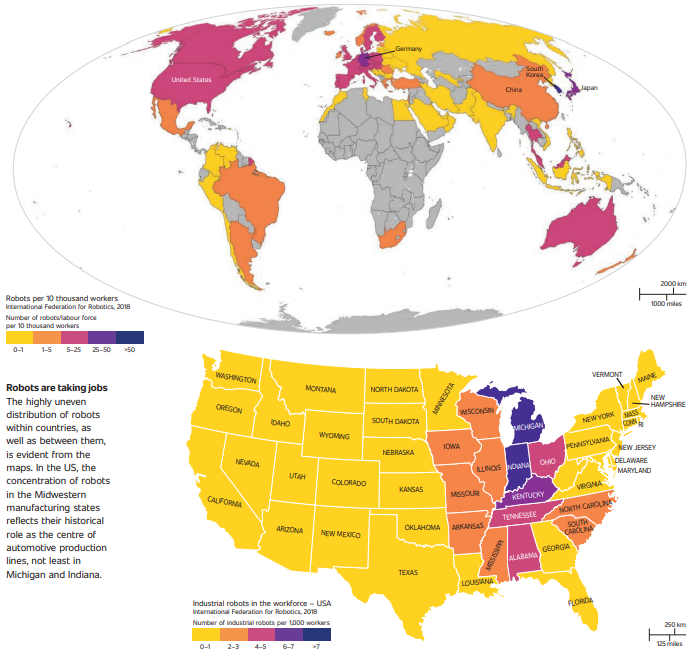
Our maps depicting automation—especially jobs at risk from robots—raise troubling questions about the future of work. They show how some parts of the world, especially poorer countries, could be hardest hit, as automation removes the middle rungs of the development ladder. There are competing views about how the acceleration of technological change and digitalization will affect employment. Some studies suggest the impacts will be low while others suggest that almost half of jobs in the US and up to two thirds of jobs in some developing countries could be automated in the coming decades.
Be Part of the Future
Sign up to receive top stories about groundbreaking technologies and visionary thinkers from SingularityHub.

Deepening Inequality
The highly differential impact of technological change on different groups of workers has been revealed and exacerbated by the Covid-19 pandemic. While some of us have been able to work securely from our homes, others have had to travel to their “essential” jobs, at times risking their lives, and many have become unemployed.
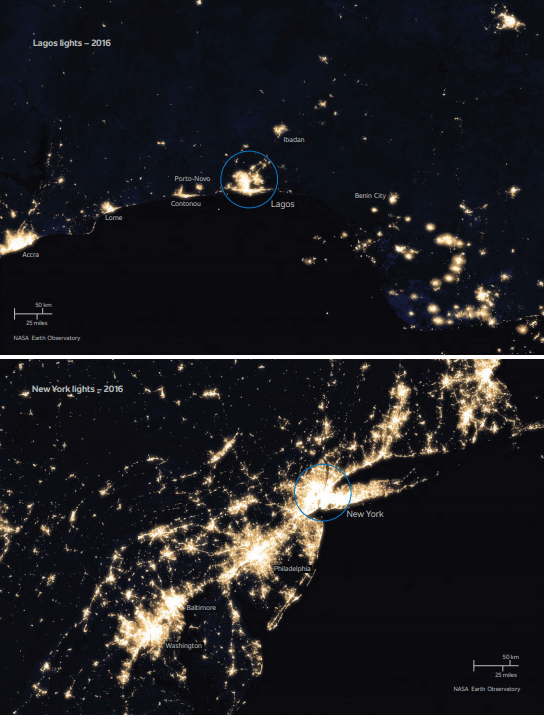
Inequality within countries and globally has increased as the wealth of the top one percent has soared, while nearly 125 million people around the world have fallen into extreme poverty (having to live with incomes of below $1.90 per day). Maps reveal the extent of these inequalities. The images of the sky at night compares the luminescence of the US and Europe to that of Africa, providing a stark reflection of the fact that New York state alone consumes more energy than 48 countries in Africa.
Health Risks Looming
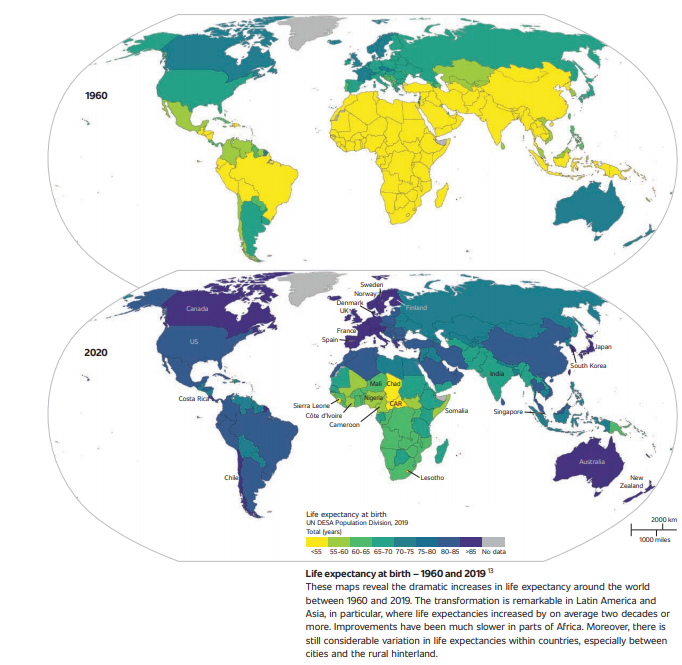
One of the most unheralded achievements is that humans are living longer lives than ever before. For about 150,000 years, average human life expectancy averaged between 20 and 25 years. Then something extraordinary happened. Between the 19th and 21st centuries, life expectancy almost quadrupled. This is due to better diets, medicine, reproductive health, and education. But as the pandemic painfully reminds us, we cannot take this progress for granted.
Bacteria and viruses are still our greatest enemy. Humanity started winning the war on bacteria and viruses about 100 years ago with the rise of antibiotics and penicillin. But we are overusing them, giving rise to antibiotic resistance. Specialists fear we are approaching a post-antibiotic era, and this would be terrifying, costing hundreds of millions of lives and trillions of dollars in losses. The rise of the anti-vax movement is a more dangerous threat than many fully appreciate. These and other risks are a reminder that global cooperation is more important than ever.
Geopolitics: Threats and Solutions
Digital and wireless technologies are reconfiguring and rewiring our politics, economics, and sense of belonging. At the same time, maps are a reminder of the continued influence of geography in shaping our lives and political destiny. Mountain chains, vast oceans, sprawling deserts, and dense forests still continue to exert a powerful influence on the fate of nations.
Maps of global infrastructure reveal the underwater cables, terrestrial pipelines, and transportation networks that connect us. They highlight dense areas of connectivity, but also dark areas that are figuratively and literally off the grid. They also show how our politics remains trapped in a bygone era and has failed to keep pace with the growing complexity and connectivity of all global systems and people.
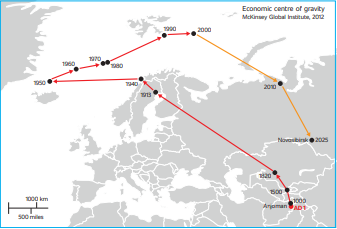
The maps reveal the multipolar character of our international relations and expose the global reach of certain countries. For example, the map on the US military footprint includes over 800 bases and 200,000 active personnel in over 177 countries. Meanwhile, the map on China’s Belt and Road Initiative shows the terrestrial and marine investments that include over 2,600 projects spanning over 100 countries. As another map shows, economic power and influence is steadily moving eastward over the past 75 years after 2,000 years of drifting west.
Shaping Our Future
The future cannot be predicted with certainty, but it can be shaped. Climate change, the spread of AI, and nuclear weapons are all critical existential threats that could doom us all.
Using maps, our aim is to improve the understanding of the forces that shape the present and how this may evolve catastrophically in the decades to come. By harvesting the progress and addressing the critical challenges, history has taught us that we can change our fate. Our urgent challenge is to engage more actively to contribute to a more inclusive and sustainable world.
Banner Image Credit: NASA

Robert Muggah specializes in smart cities, digital resilience, public security, and the design of new technologies. He is cofounder and principle of the SecDev Group—devoted to supporting clients mitigate digital risk, strengthen cybersecurity and harness the digital economy. He is co-founder and research director of the Igarapé Institute—an award-winning think and do tank working on data-driven safety and justice based in Latin America and Africa. Robert advises McKinsey, Google, and Uber, and is an associate at Princeton University. For two decades he has advised national and municipal governments and international organizations on issues ranging from crime prevention and stabilization to urban planning and climate resilience. Robert is (or has been) a fellow or faculty at the University of Oxford, the University of San Diego, the University of British Columbia, the Catholic University of Rio de Janeiro, and the Graduate Institute in Switzerland. Between 2000 and 2010, he founded a think tank focused on security (based in Geneva). He advises the World Economic Forum's Council on the Future of Cities and is a multi-term adviser to the annual Global Risk Report. Robert has authored eight books—most recently Terra Incognita (with Ian Goldin, Penguin/Random House 2020) and many peer-reviewed articles. He is a regular contributor to the Atlantic, BBC, CNN, El Pais, Financial Times, Folha de São Paulo, Foreign Affairs, Foreign Policy, Guardian, Economist, New York Times, Newsweek, USA Today, and Wired, and he gave TED talks in 2015, 2017, and 2019. Robert received his DPhil from the University of Oxford.
Related Articles

Industries Most Exposed to AI Are Not Only Seeing Productivity Gains but Jobs and Wage Growth Too

US Issues Grand Challenge: The First Fault-Tolerant Quantum Computer by 2028

Five Ways Quantum Technology Could Shape Everyday Life
Industries Most Exposed to AI Are Not Only Seeing Productivity Gains but Jobs and Wage Growth Too
US Issues Grand Challenge: The First Fault-Tolerant Quantum Computer by 2028
Five Ways Quantum Technology Could Shape Everyday Life
What we’re reading