Scientists Complete the Most Detailed Map of the Brain Ever

Share
To me, maps always conjure up a sense of exploration.
Back in the Age of Discovery, rudimentary maps allowed European explorers to sail into the vast unknown. They began charting new worlds, and in turn, made newer maps that helped future generations better understand the lands and seas that cover our world.
Now, thanks to a new — if slightly different — type of map, we may be approaching a new age of discovery. One that takes us into the uncharted territories of the mysterious three-pound organ that underlies our thoughts, emotions, hopes and dreams: the human brain.
This week, researchers at Washington University published the “most intricate” map of the human cortex to date. As the outermost layer of the brain, the cortex is perhaps the most easily identifiable structure, with its surface carved by many hills and valleys into distinctive patterns.
To many, the cortex represents the seat of human intelligence: not only does it process information from our various senses, it also drives higher cognitive functions, such as planning, strategy and self-control.
Although scientists have long mapped the structural landscape of the cortex, how it functionally organizes into regions has thus far escaped brain cartographers. By all measures, our current brain map is far too simple. And that’s a problem: how can scientists compare data if they aren’t even sure they’re looking at the same spot?
That’s the promise of this new map: a long-awaited, authoritative framework that lets scientists pinpoint exactly where they are in any given human brain.
Historical Maps: Old, But Far From Obsolete
Efforts to map the brain started long before the birth of modern neuroscience.
Early cartographers mostly relied on observations of surgeries and brain injuries to parse the cortex into distinct regions. If injury to one brain area caused a speech deficit, for example, that region was assumed to be responsible for at least one aspect of speech.
Perhaps the most famous brain map to date is Brodmann’s map, first published in 1909. Unlike his predecessors, the German anatomist Korbinian Brodmann carefully observed how brain cells are laid out across the cortex, paying no particular mind to their function. Based solely on their organization, he delineated the cortex into 52 distinctive areas.
Animated 3D model of Brodmann brain map. Credit: Mark Dow/University of Oregon
Yet later research found that Brodmann was incredibly on point: his areas correlated surprisingly well with discrete brain functions — sight, smell, sensations, movement and so on — giving serious credence to biology’s mantra of “function follows form.”
“Believe it or not, this has remained the standard in the brain imaging field,” first author Dr. Matthew Glasser told Singularity Hub.
Part of the reason why brain mapping stagnated is because it’s seriously tough business.
Every location in the brain can be described by hundreds, if not thousands, of parameters. What kinds of chemicals do neurons use to talk to each other? How do neurons connect, both within their immediate vicinity and with regions far off? How do their computations differ?
In other words, what variables should a brain mapper use to optimally partition a brain? In this study, Glasser and colleagues offered one solution.
Map on Steroids
The team began with nearly 450 different brain scans from young, healthy volunteers recruited by the Human Connectome Project.
They couldn’t have asked for better data. A combination of high-resolution MRI (magnetic resonance imaging) and functional MRI images gave researchers an unprecedented look at the cortex. There were plenty of anatomical measures: how the thickness of the cortex varied across regions, how much myelin (the whitish grey material that insulates neural transmission) covered the neural tracks.
But there’s more. Data from fMRI scans provided several measures of brain function: what spontaneous activity patterns look like when the brain is at rest and where the cortex fires up with different types of cognitive tasks.
“We tried to cover the four major categories of cortical organization that have been used to define cortical areas,” explains Glasser, “architecture, function, connectivity, and topographic maps.” The last was especially important for visual areas, says Glasser, since each point that we see in space is mapped onto a different chunk in the visual cortex correspondingly.
Next, the team precisely aligned the individual maps to generate a sharp, group- averaged map, and carefully drew boundaries between areas that looked distinctively different in all four of the major categories. To double-check their results, the team compared their areas to see if they matched up with those previously reported by other neuroanatomists.
The result was a group of drawings of the brain that looks vaguely like glass paintings. The mapping effort subdivided each half of the brain into 180 separate partitions, with 83 of those already well established in the field, and 97 new areas ripe for exploration.
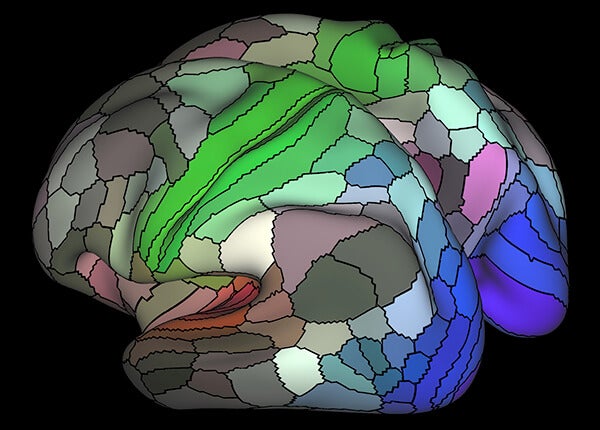
The researchers discovered that our brain’s cortex, or outer mantle, is composed of 180 distinct areas per hemisphere. For example, the image above shows areas connected to the three main senses — hearing (red), touch (green), vision (blue) and opposing cognitive systems (light and dark). The map is based on data from resting state fMRI scans performed as part of the Human Connectome Project. Credit: Matthew Glasser, Ph.D., and David Van Essen, Ph.D., Washington University
Each area of the map contains cells that are similar in their structure, connectivity and function. Between areas, however, those parameters significantly differed.
Be Part of the Future
Sign up to receive top stories about groundbreaking technologies and visionary thinkers from SingularityHub.

This is just like different countries have well-defined borders and unique cultures, the study’s lead author Dr. David Van Essen told Nature.
But that’s not all. Another finding surprised the team while they were validating their areas on a new set of brain scans. To help automate the process, they developed a machine learning algorithm to learn the “fingerprint” of each cortical area — that is, the specific setting of each parameter used to generate the map.
Validation showed that the areas are accurate on average. The individual variability, however, took the researchers by surprise. Not only did the size of each area differ between people, some subjects had “extra” regions that aren’t part of the original average map.
These differences may be very helpful in mapping individual variability in brain function or connectivity, says Glasser.
From Brain Map 1.0 to 2.0
The applications of this revamped brain map are immediate and immense.
It’s basically a standardized atlas that lets brain imaging researchers know where exactly they are in the human brain, says Glasser. This makes brain activation studies much more readily comparable between different groups, something especially helpful given the ongoing controversy questioning the validity of brain scans as a whole.
The team also plans to release their algorithm to help other researchers generate individualized brain maps to help with their respective research or medical goals.
An obvious application of the brain map is in surgery, that is, mapping an individual’s brain areas to help surgeons avoid important brain areas when operating, says Glasser.
By comparing patterns between healthy and diseased brains, researchers may even find better ways to diagnose brain disorders. Current biomarker studies often look to a single parameter as a smoking gun, but it’s hard to find a measure that reliably changes in every patient at every step of disease progression.
Since the new brain map itself incorporates many distinct parameters, there’s high hope that it’ll yield more versatile and accurate markers for tough-to-diagnose brain disorders like Alzheimer’s disease.
“This is a major step towards identifying cortical areas rather than just looking at a compressed representation of information provided by a single modality,” says University of Dusseldorf professor Dr. Simon Eickoff, who was not involved in the study, to Singularity Hub.
It’s the birth of a new field that combines neuroanatomy with machine learning to help us get to a deeper understanding of the multi-module, multi-layer organization of the brain, says Eickoff.
Excitement aside, Glasser is eager to point out that this is just brain map 1.0.
For one, brain function can be represented at multiple processing levels. Some researchers are mapping out brain activation at the level of a single synapse — that is, the hub where one neuron talks to another. The scalability of this approach is hard to predict, but its incredibly fine-grained dissection of the brain could supplement higher-level maps like Glasser’s to give researchers a more complete picture of the inner workings of the brain.
When it comes to understanding how these brain areas work, we’re just scratching the surface, says Glasser. We’ll need much more research to figure out what kinds of computations they are performing to lead to different kinds of behaviors, he says.
I, for one, am looking forward to learning about the uncharted New Worlds of our brains.
Banner image credit: Matthew Glasser, Ph.D., and David Van Essen, Ph.D., Washington University
Related Articles
")
This Week’s Awesome Tech Stories From Around the Web (Through August 1)

Europe Approves Bionic Eye to Restore Vision Lost to Blindness

‘Hello There the Jacobian Conjecture Is False Thanx’: Why a Tiny Social Media Post Has Mathematicians Rethinking AI
This Week’s Awesome Tech Stories From Around the Web (Through August 1)
Europe Approves Bionic Eye to Restore Vision Lost to Blindness
‘Hello There the Jacobian Conjecture Is False Thanx’: Why a Tiny Social Media Post Has Mathematicians Rethinking AI
What we’re reading