Can the Sustainable Development Goals Be Measured by Satellite?
Share
In 2015 the UN established 17 Sustainable Development Goals (SDGs) to be met by 2030. From universal access to clean water and education to gender equality and strong institutions, achieving the SDGs would mean a higher quality of life for people all over the world, and most importantly, for the poor and vulnerable.
A handful of countries are on track to meet SDG targets, but many more are lagging behind. Achieving the SDGs is challenge enough—but what about measuring them? Economists have estimated that conducting household surveys to monitor socioeconomic targets could cost as much as $254 billion over the lifetime of the SDGs. Reliability and consistency of data across countries is also an issue.
Is there a better way? In a paper published earlier this month in Proceedings of the National Academy of Sciences, a team from Aarhus University in Denmark explored the viability of using satellite data to monitor and measure some SDGs.
What’s Being Measured, and How?
Most of the SDGs are, by nature, hard to measure. How do you know if gender equality is advancing in a specific country or city? Or whether we’re taking enough action on climate change?
To better tackle these complex and multi-faceted questions, the UN established 169 targets and 232 indicators, ranging from “Tuberculosis incidence per 100,000 population” (3.3.2), “Participation rate in organized learning, by sex” (4.2.2), and “Proportion of countries where the legal framework guarantees women’s equal rights to land ownership” (5.a.2).
This is a start. But measurement is still not a straightforward task; as of December 2018, the UN’s Statistics Division classified just 101 of the 232 SDG indicators as ‘Tier 1,’ meaning the indicator is conceptually clear, has an established methodology and set of standards, and data are already regularly produced by at least half of the countries where the indicator is relevant.
And that’s just the tip of the (lopsided) iceberg. The UN Statistical Commission is in charge of monitoring the progress of the SDGs, and obtains the lion’s share of its data from national governments. But national governments can’t always be trusted to provide accurate and impartial figures. In fact, for some indicators—such as those that deal with corruption, bribery, and accountable institutions—governments shouldn’t be self-reporting at all.
Household surveys are the traditional method for collecting data on population, employment, health, poverty, and many other indicators. But low-income countries—precisely those where progress is most needed and thus should be monitored most carefully—often don’t have the resources or capacity to carry out these surveys, and data quality varies widely between countries.
Is There a Better Way?
The Aarhus University study used remotely-sensed satellite data to monitor rural poverty in low and middle-income countries, analyzing land use data from satellite images for a group of rural villages in Kenya. Similar preceding studies had used a single-level approach, which assumes that land between different households (called ‘buffer zones’ in the paper) can be utilized by both. This is often not the case, though, and can make a significant difference in the assumed wealth of a household. The Aarhus team used a multi-level approach, which maps and relates common resources to single households.
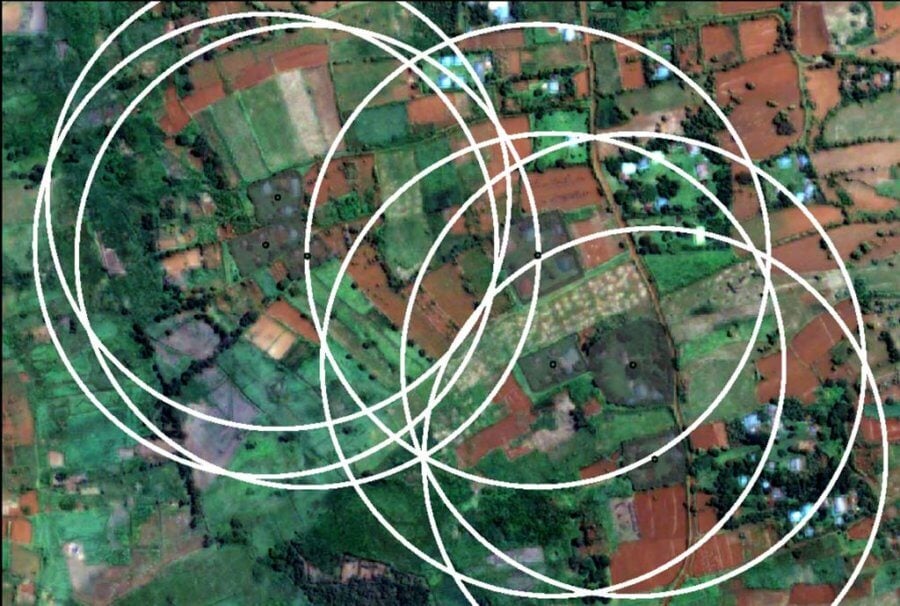
The single-level approach to linking satellite and household data often uses a single radial buffer zone. This can be problematic as it results in overlapping regions and multiple pixels being assigned to multiple households when households would not have access to some land parcels such as multiple homesteads. Image Credit: Copyright © 2019 Gary R. Watmough, Charlotte L. J. Marcinko, Clare Sullivan, Kevin Tschirhart, Patrick K. Mutuo, Cheryl A. Palm, and Jens-Christian Svenning. Published by PNAS. / CC BY-NC-ND 4.0
"The method that we have developed is designed to analyze the satellite images in a way that takes into account that people have access to and use different resources in the landscape at different levels,” said professor Jens-Christian Svenning, who heads the research group in Aarhus. “Some use the area just around their house, while others use the common areas of a village. When we use space data with a socio-ecological insight, we capture the financial status and in this way also the development in an area much better than we have previously been able to.”
The team’s method was able to identify the poorest households with 62 percent accuracy, with the most significant indicator of household wealth being the size of the buildings on a family’s property. The proportion of unused land next to and within individual properties were also taken into account, as was the length of the growing season.
Logically, properties with small buildings and more unused land tended to be occupied by poorer families, while wealthier families generally had larger buildings and were more likely to invest in “greening” their surrounding land.
Be Part of the Future
Sign up to receive top stories about groundbreaking technologies and visionary thinkers from SingularityHub.

62 percent accuracy may sound unimpressive, but the team used just one satellite image to predict household wealth, which involves several complex variables. Their results showed a 10 percent improvement in accuracy over the single-level approach that was previously used.
The study authors believe that with some fine-tuning, their method could be a far more cost-effective way to monitor the progress of some SDGs, especially as satellite data becomes easier and cheaper to obtain. In fact, for targets involving the use and protection of forests and oceans, satellite data may be the only effective way to monitor progress.
A few of the targets where satellite data would facilitate measurement include "Index of coastal eutrophication and floating plastic debris density" (14.1.1), "Forest area as a proportion of total land area" (15.1.1), "Proportion of land that is degraded over total land area" (15.3.1), and "Mountain Green Cover Index" (15.4.2). And these are just the obvious ones; there are likely many more.
"The use of satellite images makes it much, much cheaper to keep track of how far we are in reaching the UN's goals for sustainable development,” said Gary Watmough, lead author of the study. “If conventional assessments of the households' economic conditions were used, the cost would be more than 250 billion dollars.”
Lofty Goals, Thorny Questions
The sustainable development goals as a whole have met with some harsh criticism due to their sprawling, possibly over-ambitious nature; as Danish economist Bjorn Lomborg put it, “Giving priority to 169 things is the same as giving priority to nothing at all.”
Lomborg estimated the SDG monitoring framework could cost as much as $1.5 billion per target, meaning measurement alone would account for 12.5 percent of total development aid.
Exploring more cost-effective measurement options, then, is essential. Satellite data appears to be a viable possibility, but needs to become more reliable, and even then only a handful of SDGs lend themselves to this means of measurement.
But lightening even a small portion of the measurement burden, and having consistent international standards for indicators that currently lack them, would be a big step forward, and would ideally free up a substantial chunk of the aid budget to be redirected to where it’s needed most.
Image Credit: TommoT / Shutterstock.com
Vanessa has been writing about science and technology for eight years and was senior editor at SingularityHub. She's interested in biotechnology and genetic engineering, the nitty-gritty of the renewable energy transition, the roles technology and science play in geopolitics and international development, and countless other topics.
Related Articles

Forget Code: AI Is Learning to Hack Society

Companies Could Soon Staff ‘Stubbornly Local’ Jobs With Workers 4,000 Miles Away

Precise Gene Editing in Early Human Embryos Reignites the ‘Designer Baby’ Debate
Forget Code: AI Is Learning to Hack Society
Companies Could Soon Staff ‘Stubbornly Local’ Jobs With Workers 4,000 Miles Away
Precise Gene Editing in Early Human Embryos Reignites the ‘Designer Baby’ Debate
What we’re reading